Many businesses struggle to reach their goals. Even if you try multiple things, you’ll find it hard to decide on your next steps without an understanding of where you’re at and what’s working (and what’s not).
Efficient sales reports give you and your team the right insights. With a good sales reporting process, you can find out the most important sales data, in order to make better decisions.
So what are the different types of sales reports? And how can you make your own?
What Is a Sales Report?
A sales report is a record of your sales activities during a specific timeframe. Depending on the type of sales report, you may include in your sales report the following data:
- The name of your sales reps
- The sales made vs the sales quota
- Revenue
- New accounts
- Comparisons between the current and previous periods
Sales reporting can be used to predict growth and potential issues—by extrapolating the data they offer.
These reports are usually produced by sales managers and sales reps. Then they’re sent to upper management, who want to be able to easily understand the sales status.
Which Types of Sales Reports Should You Be Aware Of?
These are the main types of sales reports…
Daily Sales Report
This report details a sales rep or sales team’s activities per day. They’re used to report the sales performed by one or multiple salespeople and detail how the team performs. These reports can include the amount of contact with potential clients, the leads qualified, and the sales. They may be produced by the sales manager or the sales reps themselves.
Since these reports are produced every day, they’re usually kept among the team or given to upper management, and they include as few details as possible. Typically, they’re not used to predict growth. Instead, they’re used as more of a constant update.
Weekly Sales Report
These reports track your team’s productivity every week. So you can easily see how well your team is doing as far as reaching your monthly goal. Weekly reports usually include more data than daily reports (such as your growth predictions and comparisons between the current and previous weeks).
Monthly Sales Report
These reports give you a broader perspective on your sales team’s performance. They are usually the most important regular reports a sales manager may produce each year, and upper management examines them in monthly meetings.
Unlike other reports, monthly sales reports are the most important ones, as far as looking at your progress. They allow you to accurately predict sales and give you a better idea of your team’s areas of opportunity.
Annual Sales Report
A yearly sales report details your sales team’s activity and level of success. In addition to being the most detailed reports, they are used to show the impact of seasonal trends and the success of marketing campaigns.
Annual reports are also used to set the next year’s quotas and goals, as well as decide on sales management issues (such as your sales team’s expansion and budget).
They typically indicate the most valuable rep, according to their productivity.
Sales Pipeline and Funnel Report
This report shows where your clients are in the funnel. They also reveal the number of deals you have made and expect to close in your sales cycle.
This report is very useful for keeping track of individual customers and finding out where clients drop off during their journey.
Sales Call Report
The sales rep usually produces a sales call report that details the number of sales calls performed and the number of leads contacted. It shows who they talked to, how long they talked to them, and how the call went.
These reports add information during the call or directly after ending it. They show how well-prepared the sales rep was and provide valuable insight into the leads your team is chasing.
Why Are Sales Reports So Important?
While writing down your sales reporting may not be the most exciting activity in the sales world, the sales data from these reports is vital to your company’s success. They can show readers how well individual reps perform and identify your most valuable salespeople. They also tell you how well-qualified the leads are and where the best leads are coming from.
Pro-tip: if you are managing large amounts of data, leverage big data analytics to provide you quality insights for your sales reports.
You can use sales reports to find out how well you’re hitting your targets, find issues with your sales pipeline, and measure how your company grows.
Through sales reports, you can find out which marketing strategies are working, and you can use their insights to affect your sales operations.
Simply put, sales reports are there to show you where you’re at compared to where you want to be. And they give you the insights you need to reach your goals.

What Are the Key Elements of a Sales Report?
Whenever you’re sales reporting, make sure it includes the following elements:
1. Project Overview
Start with your project overview. It should include the report’s objective and remind the reader of accomplishments from a previous time period. That way, the reader has an established version of the report’s background.
Your objectives on a sales report usually show how many leads you’ve pursued, how much revenue you’ve generated, and how much volume of product you’ve sold.
2. Data Breakdown
No one wants to sit for hours and read spreadsheet after spreadsheet. To make this data easier to understand, you need to break it down.
Find out what your report shows, and break down each item accordingly. Make sure you properly explain what each item is measuring, and establish a proper time frame. You can also explain fluctuations and add more information, in order to flesh out the data’s background.
Use graphs and charts to help you visually explain your data simply and intuitively. And make sure you properly explain everything about the visuals.
Make the data as easy to understand as possible.
3. Interpretation of Results
Once you’ve explained the project and fleshed out the data, it’s time to explain what the data shows you in the bigger picture.
Here’s an example: In the data breakdown, you explain fluctuations according to implementing a new strategy. In the interpretation, you can conclude whether the strategy was successful.
Identify what worked and what went wrong, and provide potential solutions. Explain how this data can impact future strategies.
In short, interpret your results to explain what your company can learn from the data.
4 Tips for Creating a Killer Sales Report
Now that you know how to lay out and create your sales reporting process, here are some tips you can use to make sure you don’t need to explain how to read sales reports to your audience. Instead, your sales report explains itself.
1. Know your audience.
When crafting your sales report, the first thing you need to consider is who’s going to read it. After all, a great sales report is only great if it shows the relevant data to relevant stakeholders in a relevant way.
Ask yourself these kinds of questions:
- Why does this person need to see this sales report?
- How much do they know about our process?
- Will they understand the data if I present it this way?
- What’s the key takeaway?
This part is crucial to the success of your sales report. The way you present a monthly report to your sales reps isn’t the same as how you present it to the CEO.
The sales team knows everything there is to know about the sales process and leads. So you can show more raw data since you know they’ll get more out of it. But to avoid confusion, the CEO may need a simplified version of the data without a lot of jargon.
2. Collect the right data.
Once you know who’ll be reading the report, find the relevant data for them. This information should answer these kinds of questions:
- Why are these peaks and valleys happening?
- How well did the team perform according to their sales quotas?
- How is sales performance going?
- What are the key datapoints in my sales cycle?
- What does the data show that helped during the sales process?
- What areas of opportunities does the data show?
For example, explain when and why a new strategy was implemented. Or show how a drop in sales in a season was predicted by a similar drop in sales last year.
3. Create the right visuals.
Now that you have the right data for the right person, you need to find ways to visually express that data. As we’ve mentioned before, the right visuals can help your audience instantly get the right picture.
To find the right visuals, consider how you’d be able to understand the data more easily. Your data probably shows that sales increased by 20%, but you wouldn’t get that idea by seeing just numbers, right?
The right charts and graphs do the explaining for you. And they let your audience understand the numbers in an organic, intuitive way.
A simple line chart can fully flesh out the number of calls and growth during a month. A pie chart is a great way to represent percentages.
To keep your audience informed and entertained, find out which visuals are the best ones for your data.
4. Keep it concise. (No fluff!)
When writing a sales report, it may be tempting to go on long tangents, in order to explain why something turned out the way it did. You may also want to show a lot of data that may be of some use for understanding your findings. But don’t relate your content to your sales report too much. Although these tangents may be useful, you should keep them to a minimum.
At the end of the day, you need to decide what matters the most to your readers. Let the data speak for itself even if your audience is interested in going through charts and numbers all day.
Do your best to keep your sales report as simple as possible. Then, your audience can focus on what really matters.
Sales Report Examples and Templates You Can Use
Ready to start crafting your sales report? Here are the best sales report templates to help you get started…
Daily sales report template

This daily sales report template from status.net is great for anyone who wants to get as much information as possible—as quickly as possible. All you need to do is fill out the form, and the daily sales report will be created for you!
Weekly sales report template

This weekly sales report template by status.net shows your day-to-day hours, numbers, and revenue, and it compares your goals to your totals. You don’t need to sign in anywhere to use it Simply click to download!
Monthly sales report template

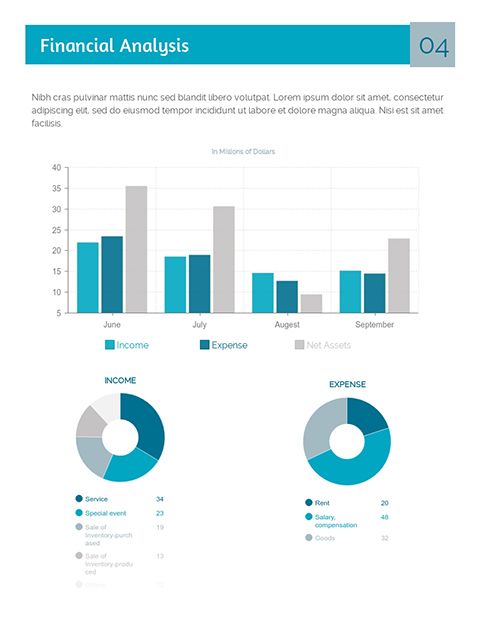
Looking for a monthly report to show at your monthly meetings? This professional-looking template by visme.co produces a perfect report to show both upper management and investors. Fill the template with your information, and print it out. Then your audience can follow along with your presentation.
Personalize it with your logos and colors, and save your brand elements in order to use them later. You can also add more visuals if you need to and download it in an interactive version you can use during your presentation.
Annual Sales Report Template
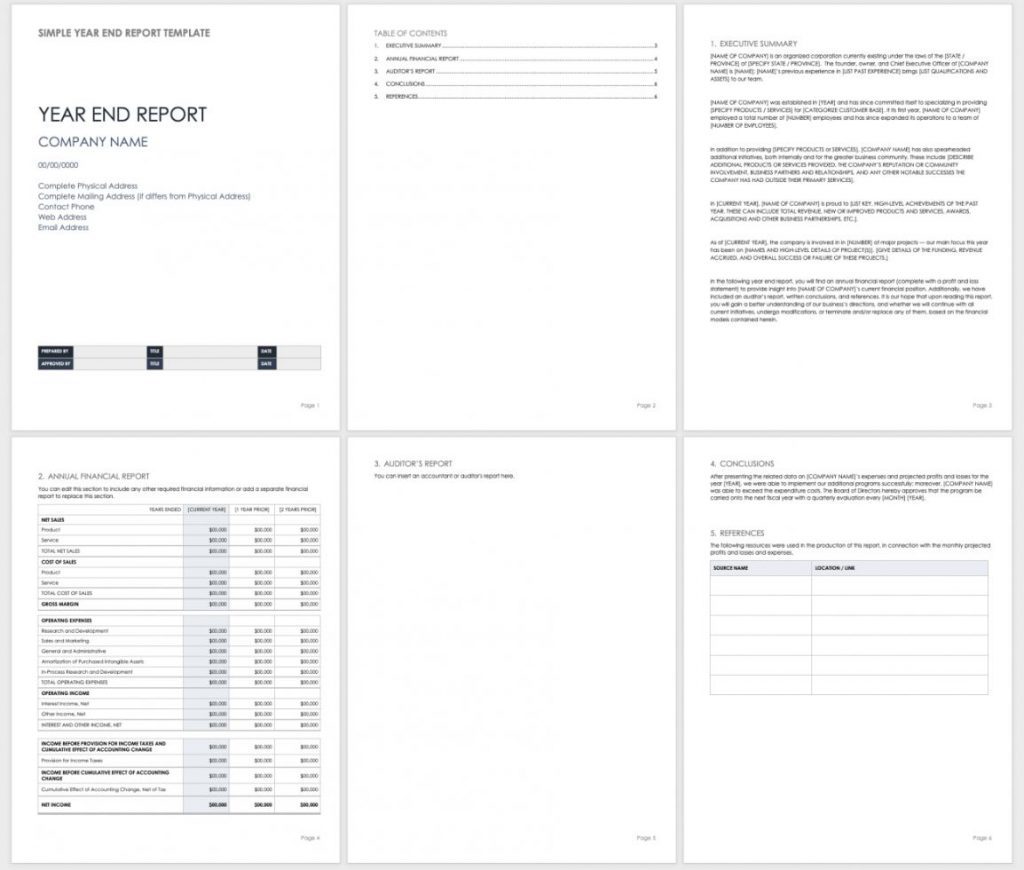
Yearly sales reports are the most important ones you can craft. This annual report template by smartsheet gives you a stripped-down version of an annual report. With its pre-built tables and formats, you can simply populate it with your information. You can also add more tables and pages and then customize the report to reflect your company’s visuals.
Sales Pipeline Report Template
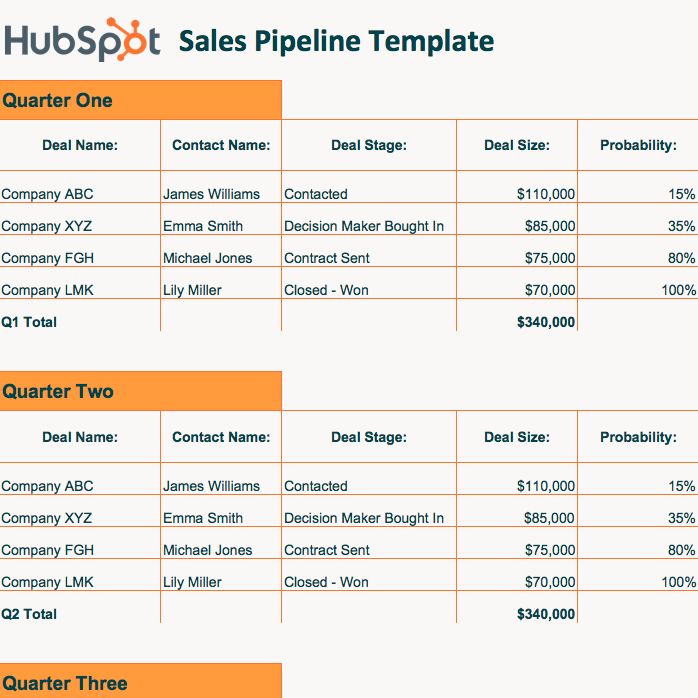
Sales pipeline reports can become very complex, and their jargon and numbers can confuse people. So, this pipeline report template by Hubspot is perfect for you. You can use it to show your progress to a third party and keep track of each lead yourself.
You can also see the probability of each lead, which will help you know which salesperson should tackle them and find out how well they’re expected to do.
Sales activity report template

This simple weekly sales activity by Microsoft Office allows you and your team to keep track of each salesperson, in order to find out who’s reaching their goals and who needs some help. It breaks down sales and gives you a total in a very straightforward, intuitive chart.
You can download it and immediately start using it for free in Excel.
Conclusion
Sales reports are incredibly valuable tools for measuring how well your sales team is performing and showing your findings to any audience.
As long as you keep track of the right data and keep your audience in mind, you’ll be sure to craft an efficient sales report for your next meeting!