Are you tired of staring at marketing dashboards that show plenty of activity (clicks, impressions, leads) but give you no real clarity on future revenue? You’re investing the budget, but when leadership asks “What will our revenue look like next quarter?” the answer feels more like a guess than a forecast. This uncertainty isn’t just frustrating; it’s a career risk. It leads to tense budget meetings, sales teams questioning lead quality, and a constant feeling that you’re flying blind. But what if you could trade that uncertainty for control? What if you had a clear set of key performance indicators designed not just to track the past but to accurately predict future revenue? This article provides the blueprint.
What Are KPI for Lead Generation?
Lead Generation KPIs are specific, measurable metrics used to evaluate the effectiveness of marketing and sales efforts in generating qualified prospects that contribute to revenue goals. In digital marketing, tracking the best lead generation KPIs is essential for measuring campaign effectiveness and optimizing strategies across channels like SEO, PPC, and social media. Unlike vanity metrics such as social media likes, page views, or follower counts, lead generation KPIs provide actionable insights by connecting marketing activities directly to business outcomes.
For example, while “website traffic” is a metric, “lead-to-customer conversion rate” is a KPI because it measures the percentage of leads that become paying customers, directly reflecting the quality of leads and the efficiency of the sales funnel. Identifying the most important lead generation KPI for your business is crucial, as it helps you focus on the metrics that truly impact lead quality and conversion rates. Key examples of revenue-focused KPIs include Cost per Lead (CPL), Customer Acquisition Cost (CAC), Customer Lifetime Value (CLV), and Marketing Qualified Lead (MQL) to Sales Qualified Lead (SQL) conversion rates.
Why Should You Track Lead Generation KPIs?
You should track lead generation KPIs because they replace guesswork with data-driven strategy. Tracking these metrics improves ROI and budget optimization, enables funnel analysis and performance improvement, enhances sales and marketing alignment, and empowers data-driven decision-making.
By tracking metrics like Cost Per Lead and conversion rates for different channels, businesses can calculate the Return on Investment for their marketing spend and allocate budget more effectively. Tracking KPIs also helps evaluate the effectiveness of different marketing initiatives, allowing businesses to identify which campaigns or strategies drive the best results and optimize future efforts accordingly. KPIs provide a clear view of the entire sales funnel, helping pinpoint bottlenecks where prospects are dropping off. They create a common language and shared objectives for sales and marketing teams, ensuring smoother lead handoffs.
KPIs empower businesses to make informed, strategic decisions based on concrete evidence rather than assumptions. Companies with a strong data culture outperform their peers by 3.2 times in revenue growth and are six times more likely to be profitable.
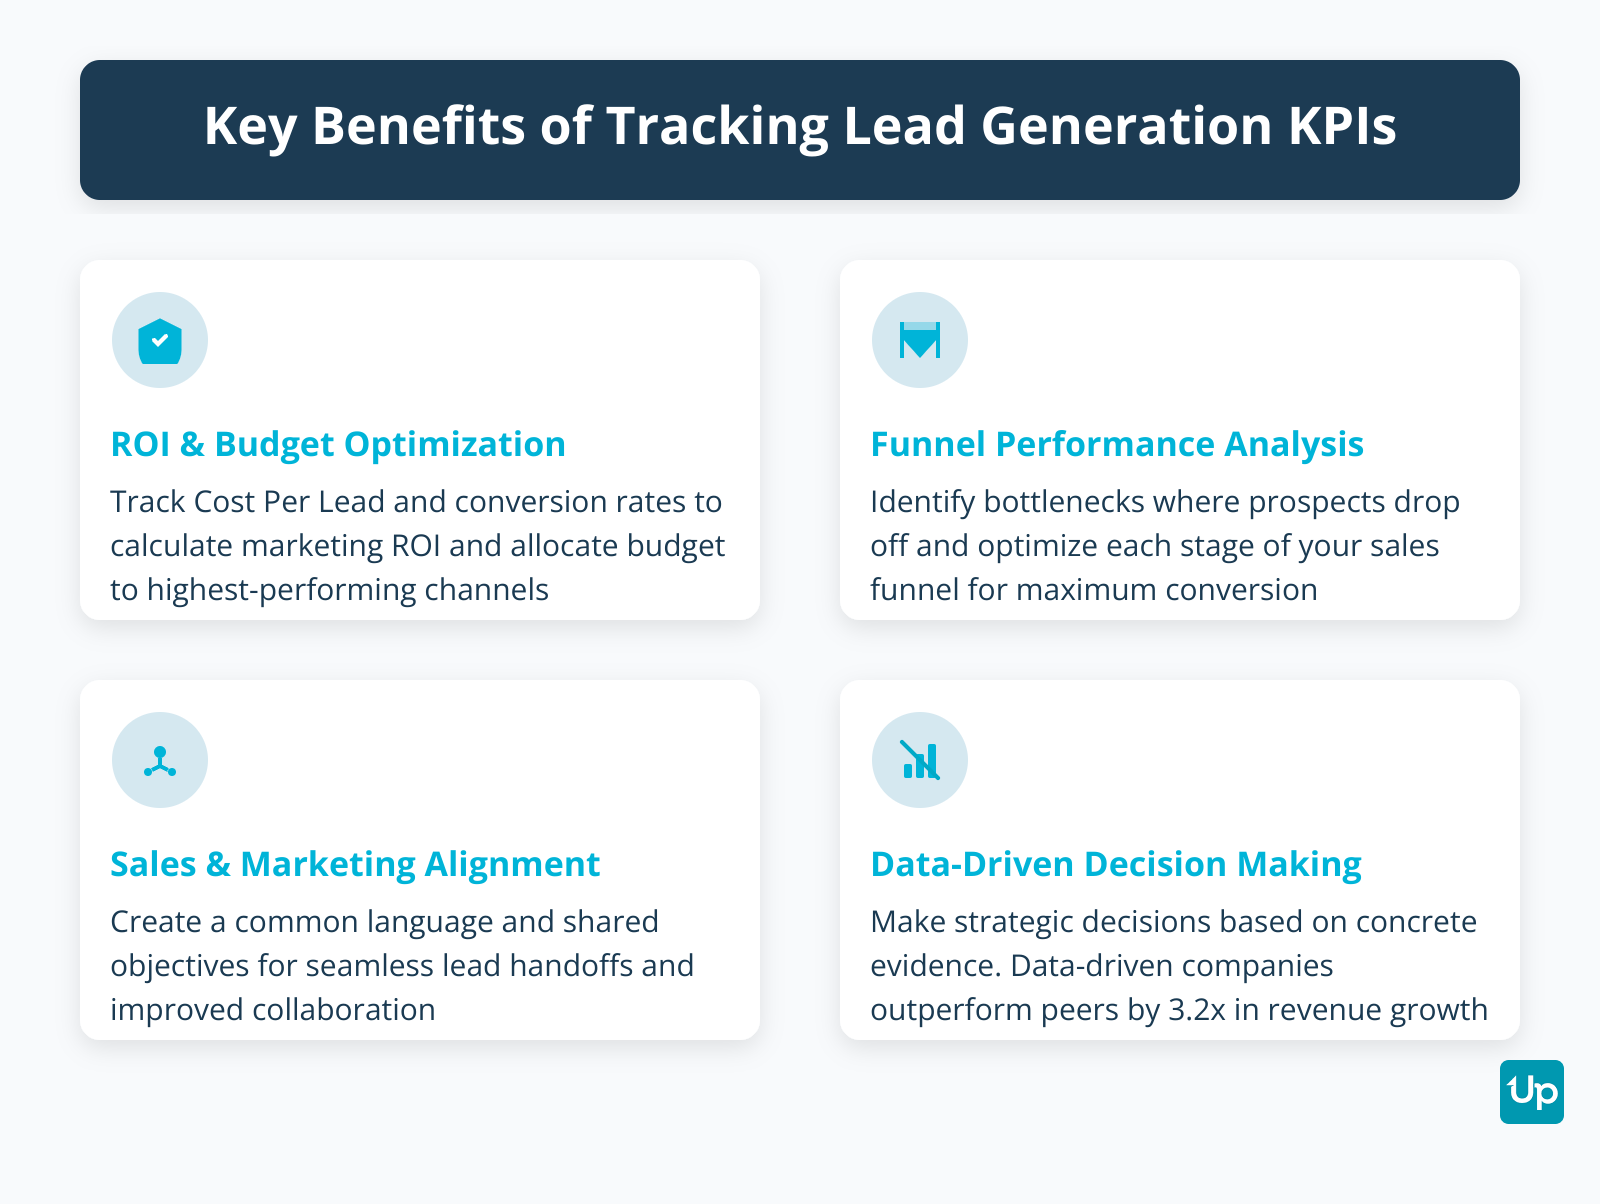
Key Benefits of Tracking Lead Generation KPIs
Core Funnel and Qualification KPIs
Understanding your sales funnel requires tracking specific metrics at each stage. These KPIs help you identify where prospects enter your funnel, how they move through it, and where they drop off. Monitoring these KPIs is essential for refining your lead generation strategy and improving lead generation performance.
What is your website traffic-to-lead conversion rate?
Your Traffic-to-Lead Conversion Rate measures the percentage of website visitors who convert into a lead by taking a desired action, such as filling out a form, signing up for a newsletter, or downloading a resource. The standard formula is: (Number of New Leads / Total Number of Website Visitors) × 100.
While overall website traffic is a useful top-level metric, it is considered a “vanity metric” if not paired with conversion data. Focusing on the conversion rate shifts the perspective from simply attracting visitors to effectively converting qualified traffic into tangible business leads.
Metrics like Time on Page, Bounce Rate, and Click-Through Rate are diagnostic metrics used to understand why the Traffic-to-Lead rate is high or low. Average session duration is another key engagement metric, reflecting how long visitors stay on your site and indicating content relevance. A low average session duration may signal that visitors are not finding how much value they expect, prompting a review of content quality. Average time on page and average session duration are important metrics for understanding how long visitors stay before leaving. Engagement metrics, such as likes, shares, and comments, are also indicators of how well your content is received.
Bounce rate measures the percentage of visitors who leave a website without interacting with it. A high bounce rate means visitors are leaving the site without engaging with other pages. A low bounce rate indicates that visitors are engaging with your content, which is a sign of effective lead generation strategies. A high bounce rate or a high exit rate on a critical landing page can indicate a mismatch between ad copy and page content, poor user experience, or a broken form. B2B traffic-to-lead rates average around 1-3%.
How do you track the number of leads?
The total number of leads generated determines the top of your sales funnel. A new lead refers to a potential customer who has shown interest in your product or service for the first time, and tracking new leads is crucial for measuring the effectiveness of your lead generation efforts. This metric provides important insights into how efficiently campaigns and strategies can generate high-quality leads that end in conversions. Cost per lead is calculated by dividing the total marketing spend by the total number of new leads, helping you understand the efficiency of your marketing investment. Identifying your main lead channels helps you discover where your leads are coming from and assess the effectiveness of your marketing strategies. Most analytic tools provide website traffic reports that show where most of your website traffic originates from.
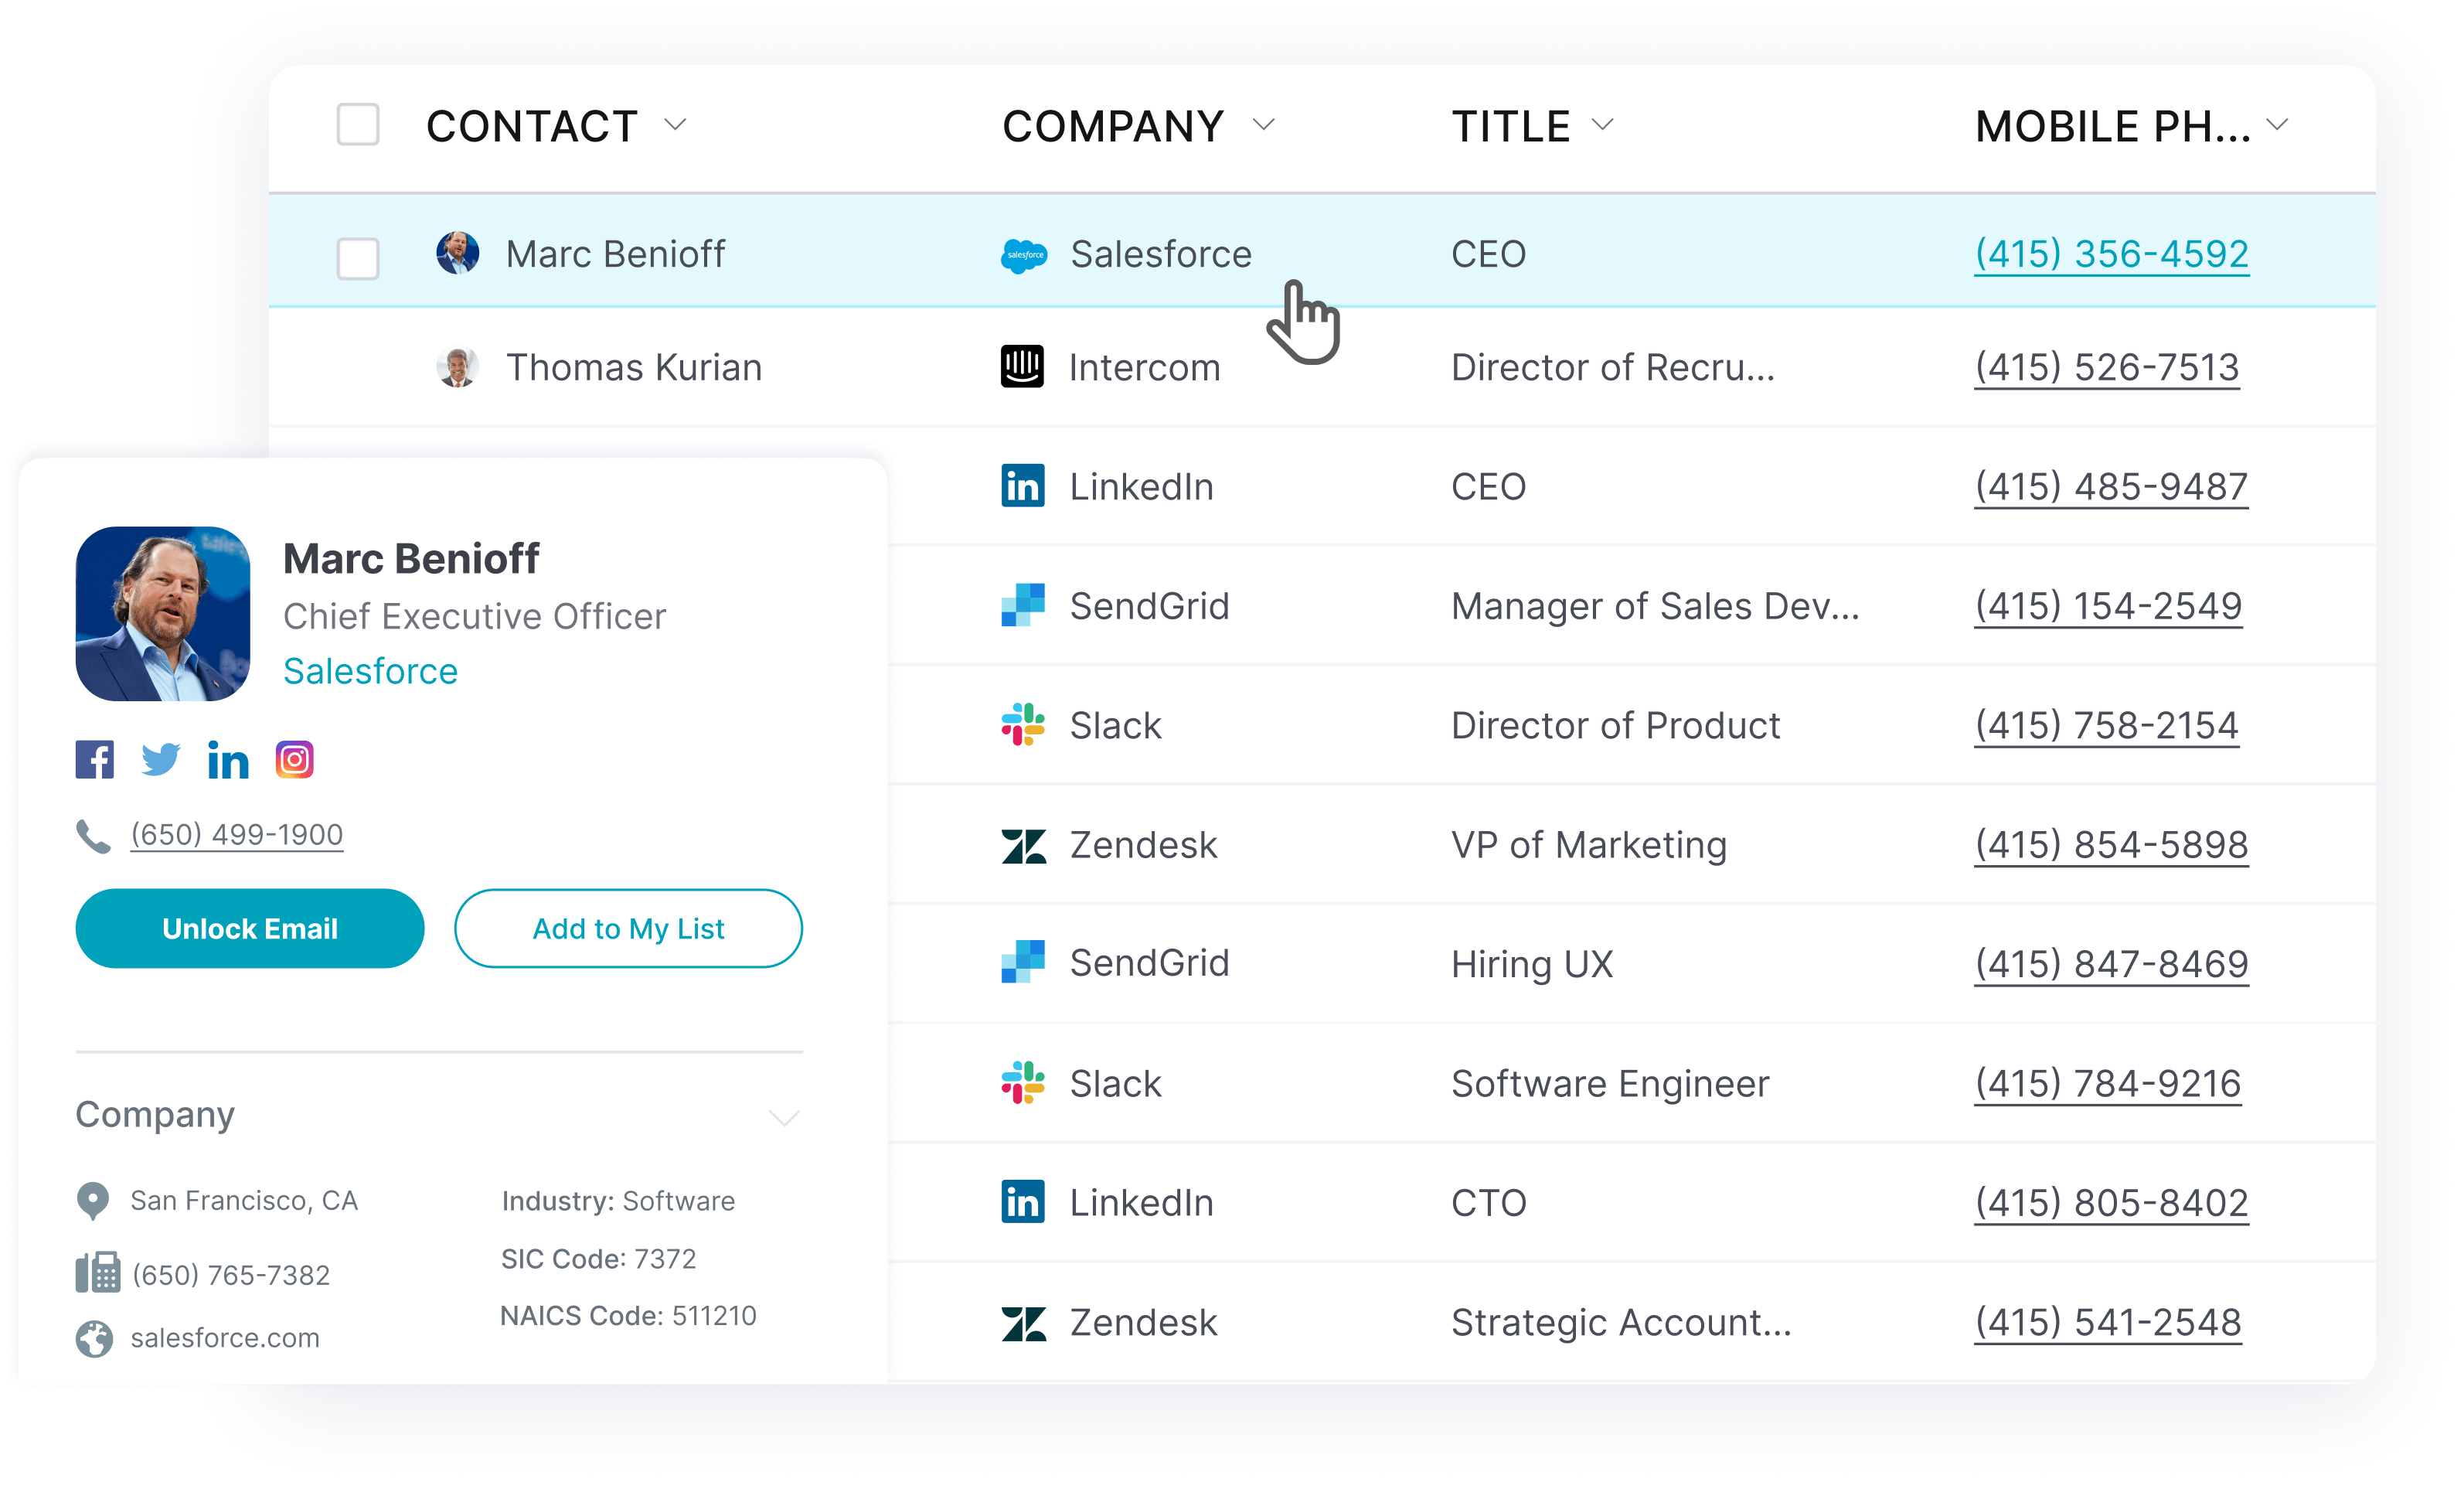
A key component of lead quality is data accuracy. Using a B2B data provider like UpLead, which offers a 95% data accuracy guarantee, can significantly improve campaign effectiveness. UpLead backs this claim with real-time email verification and a promise to refund credits for data that falls below this accuracy threshold. The platform provides access to up-to-date databases with over 180 million contact data points and dozens of filters, which makes finding and verifying qualified leads straightforward.
How do you track lead quality?
Lead quality is tracked by evaluating the accuracy and effectiveness of leads through verifying their contact details and engagement levels. Identifying the most qualified leads is essential to prioritize sales and marketing efforts and maximize conversion rates. It isn’t enough to generate a high volume of leads. It’s crucial to assess whether these leads match your ideal customer profile and demonstrate genuine buying intent. Lead Quality Score (LQS) is a predictive score that estimates the likelihood of a lead converting based on demographics, firmographics, and behavioral intent.
What is lead scoring?
Lead scoring is a methodology used to rank prospects on a scale that represents the perceived value each lead represents to the organization. Lead scoring also helps estimate the lead value, which quantifies the monetary worth of each lead and informs prioritization. The process involves assigning points, letter grades, or descriptive terms (e.g., “hot,” “cold”) to leads based on a predetermined set of criteria. The goal is to identify which leads are most likely to convert into paying customers, allowing sales and marketing teams to prioritize their efforts efficiently.
Lead scoring models analyze two main types of data: Explicit Data (Fit/Profile), which is information directly provided by the lead such as demographics (job title, location) and firmographics (company size, industry, revenue), and Implicit Data (Engagement/Behavior), which is observed behavior that indicates interest such as website visits, content downloads, email opens and clicks, and webinar attendance.
Common lead scoring models include Rule-Based/Manual Scoring, where teams manually set point values for specific attributes and actions, and Predictive Lead Scoring, which uses AI and machine learning to analyze historical data of won and lost deals.
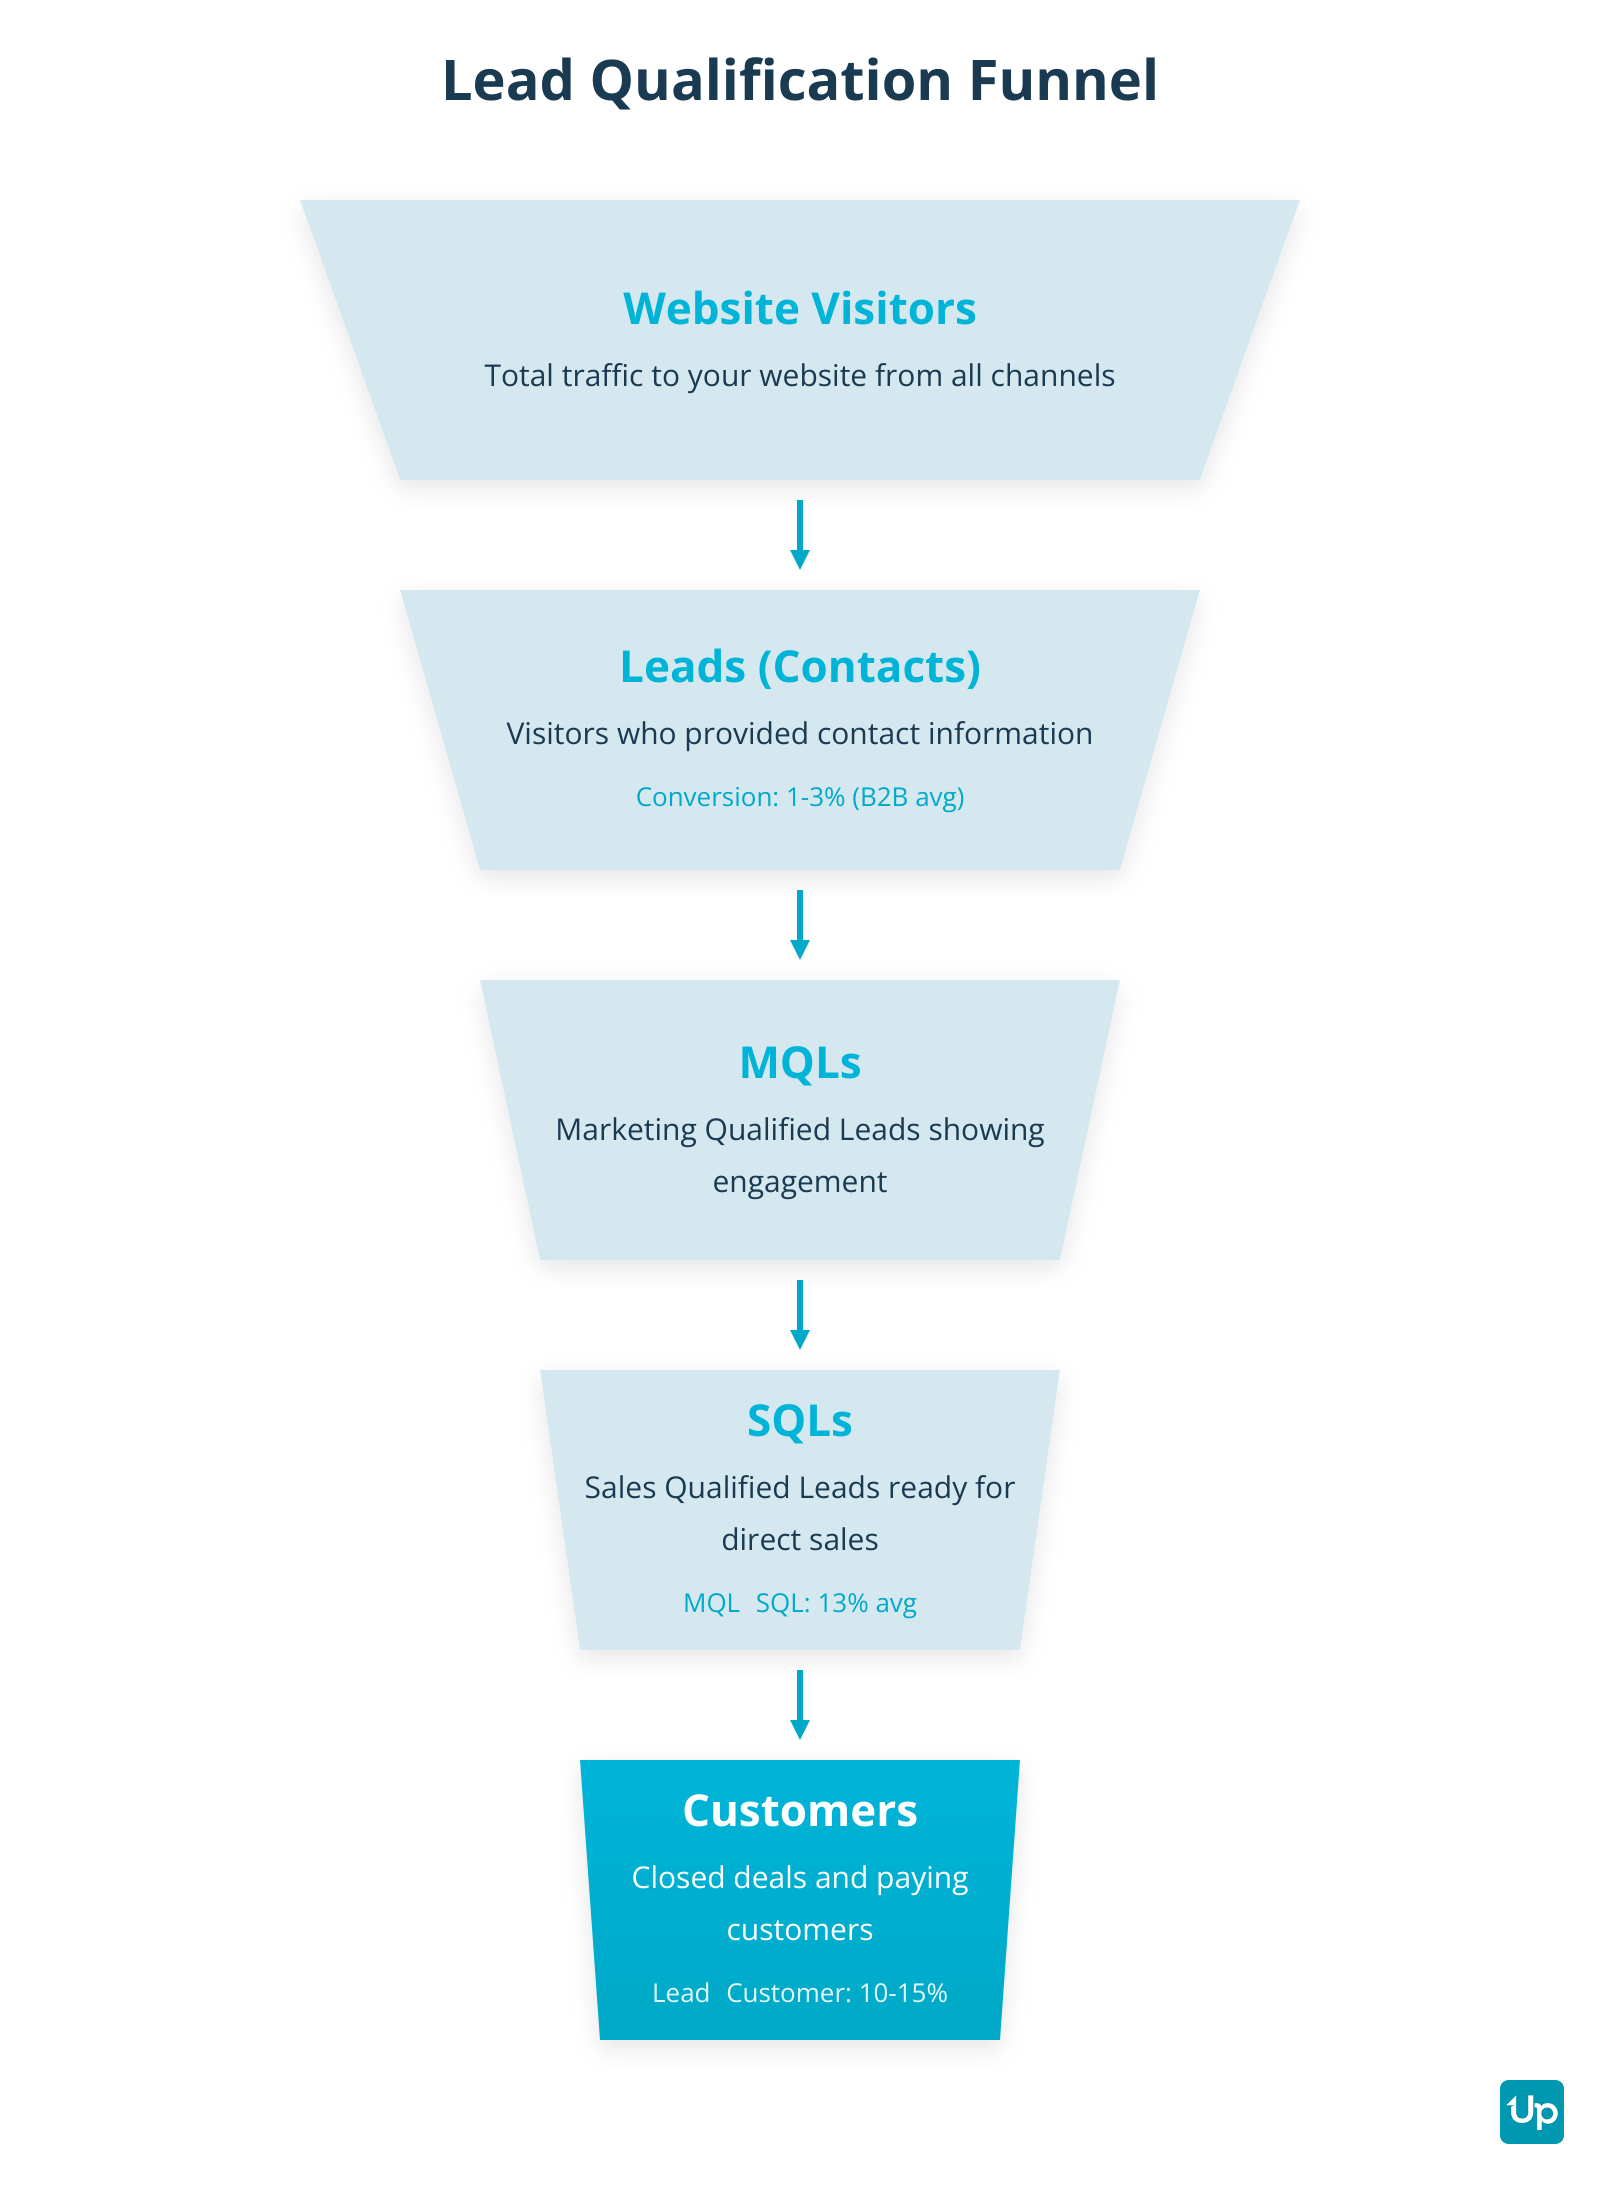
Lead Qualification Funnel Stages
What are Marketing Qualified Leads?
A Marketing Qualified Lead (MQL) is a prospect who has shown interest in a company’s offerings but is not yet ready for a direct sales conversation. Their engagement might include downloading an ebook, signing up for a webinar, or visiting key website pages.
What are Sales Qualified Leads?
A Sales Qualified Lead (SQL) is a prospect that has been vetted and deemed ready for a direct sales follow-up. This lead has moved beyond initial research, shows strong buying intent (e.g., requesting a demo), and often meets specific qualification criteria confirming they have the necessary budget, authority, need, and a defined timeline (a framework known as BANT).
What is the MQL-to-SQL conversion rate?
The MQL-to-SQL conversion rate measures the percentage of marketing leads that successfully become sales-qualified. Lead conversion rate refers to the percentage of leads that move from one stage to another in the sales funnel, such as from MQL to SQL, and is a key metric for evaluating marketing effectiveness. The formula is: (Total Number of SQLs / Total Number of MQLs) × 100. The average MQL-to-SQL conversion rate is around 13% across industries, though this varies significantly by lead source, with websites achieving approximately 31% and referrals 24%. LinkedIn leads show a high conversion rate, averaging 33.33% in Q2 2024.
What are meetings booked?
“Meetings Booked” is a top-of-the-funnel metric representing the total number of meetings or demos scheduled by a sales development representative or through automated systems. It reflects the initial success of outreach efforts.
What are meetings attended?
“Meetings Attended,” also known as the show-up rate or hold rate, measures the percentage of booked meetings that the prospect actually joins. A healthy show-up rate benchmark is around 83%. The gap between meetings booked and meetings attended is a critical diagnostic tool. A large gap (i.e., a low show-up rate) can indicate several issues: low lead quality or intent, friction in the scheduling process, ineffective reminders, or a weak value proposition that fails to keep the prospect engaged between booking and attendance.
Tracking both KPIs provides a complete picture; “Meetings Booked” gauges the sales development representative’s ability to generate interest, while the “Meetings Attended” rate reveals the quality of that interest and the effectiveness of the subsequent process.
What is your lead-to-customer conversion rate?
Your lead-to-customer conversion rate is one of the most decisive KPIs for lead generation; it determines the success of your engagement efforts. The ultimate conversion rate reflects the overall efficiency and success of your lead generation and sales processes.
Excellent conversion rates come from understanding the customer journey and continually improving your sales process.
Measuring your conversion rate involves calculating the number of qualified leads that take a desired action, such as filling out a form or submitting payment data, compared to the total number of leads. This metric helps you understand how well your lead generation campaign performs. Higher conversions mean more successful marketing campaigns.
To calculate your conversion rate percentage, divide the number of successful actions by the total amount of leads and multiply by 100. For example, if you generate five leads and two make purchases, your conversion rate would be 40%. Tracking your conversion rates over time will help you understand which types of campaigns have the highest success rate and reveal any opportunities for improvement.
What is lead response time?
Lead Response Time is the duration between when a potential customer expresses interest (e.g., by filling out a web form) and when a sales representative makes the first contact. It is a critical funnel efficiency KPI because of its direct and dramatic impact on conversion rates.
The widely accepted benchmark for an ideal lead response time is under 5 minutes. Companies responding within 5 minutes are 100 times more likely to connect with a lead compared to those waiting 30 minutes. Responding within the first minute can boost lead conversions by as much as 391%. Conversely, the likelihood of qualifying a lead drops by 80% after the first 5 minutes have passed. Despite this, the average lead response time for B2B companies is alarmingly slow, often cited as 42 to 47 hours. Only about 7% of companies manage to respond within the 5-minute window, and 78% of customers buy from the vendor that responds first.
How long is your time to conversion?
One of the most important lead generation KPIs involves measuring the time it takes for leads to turn into customers. The length of your sales cycle will directly impact how quickly your business can grow. To measure this KPI, measure how long it takes for your leads to go from showing an interest in your offering to making an actual purchase and consider any delays that may have occurred along the way. Tracking time-to-close gives insight into what could impact conversions and helps refine your processes.
Essential Revenue and Cost KPIs
After tracking how leads move through your funnel, you need to understand the financial impact of your lead generation efforts. These revenue and cost metrics determine whether your strategy is sustainable and profitable.
Average revenue and average revenue generated per customer, often measured as Average Revenue Per Customer (ARPC), are important metrics for analyzing customer profitability and the effectiveness of lead generation efforts. Revenue generated is a key metric for clients as it directly reflects the effectiveness of marketing efforts.
What is Cost Per Lead?
Cost per lead (CPL) denotes the cost of acquiring and managing leads. This metric is typically calculated by measuring the total marketing costs associated with lead generation campaigns and initiatives over a given period, and then dividing this value by the number of leads acquired. For example, if your business spent $500 on campaigns for early-stage leads in February and generated 25 qualified leads, then its CPL for February would be $20 ($500/25). Measuring CPL regularly is essential to understand how lead generation impacts your marketing budget accurately and to ensure that resources are used wisely when sourcing a high volume of quality leads.
How do you calculate Customer Acquisition Cost?
Customer Acquisition Cost (CAC) is calculated by dividing the total cost of sales and marketing by the number of new customers acquired. The formula is: CAC = (Total Cost of Sales and Marketing) / (Number of New Customers Acquired).
A “fully burdened” CAC provides the most accurate picture and should include all expenses related to acquiring new customers, such as salaries for marketing and sales teams, ad spend, tools and software costs, creative and content costs, commissions and bonuses, and a portion of general overhead related to sales and marketing activities. It is important to only include costs associated with acquiring new customers, not costs for retaining or upselling existing ones.
What is Customer Lifetime Value?
Customer Lifetime Value (CLV) measures how much monthly recurring revenue a customer can generate over time. To measure CLV, calculate the total amount of money each customer has spent since their initial purchase or contract was signed. Then estimate how much additional revenue each customer will likely bring in over a specific period, such as one year or five years.
For more accurate results, consider any incremental price increases to account for potential improvements to your product or service. Your calculation should also consider all interactions with the customer over their entire relationship with your business, including operating costs, renewal fees, product or service upgrades, or discounts. With CLV data at hand, your marketing team can make informed decisions about which leads are worth investing in and optimize their lead acquisition strategies accordingly. CLV can also help determine how much of your marketing budget you need to allocate to specific channels.
One effective way to boost CLV is to improve customer service, which enhances customer retention and loyalty.
What is the CLV to CAC ratio?
The CLV to CAC ratio measures the relationship between Customer Lifetime Value and Customer Acquisition Cost. A healthy ratio is widely accepted to be 3:1 or higher. This means for every dollar spent to acquire a new customer, the business should expect to generate at least three dollars in lifetime value. Ratios below 3:1, especially approaching 1:1, suggest an unsustainable model where acquisition costs are too high relative to customer value.
Conversely, a very high ratio (e.g., 5:1 or more) might indicate underinvestment in marketing and sales, signaling missed opportunities for growth. For early-stage SaaS startups, a ratio closer to 2:1 can be normal as they refine their processes, but the goal should be to reach the 3:1 standard as the company scales. For B2B SaaS specifically, where churn is often lower, a ratio of 4:1 is a preferable target.
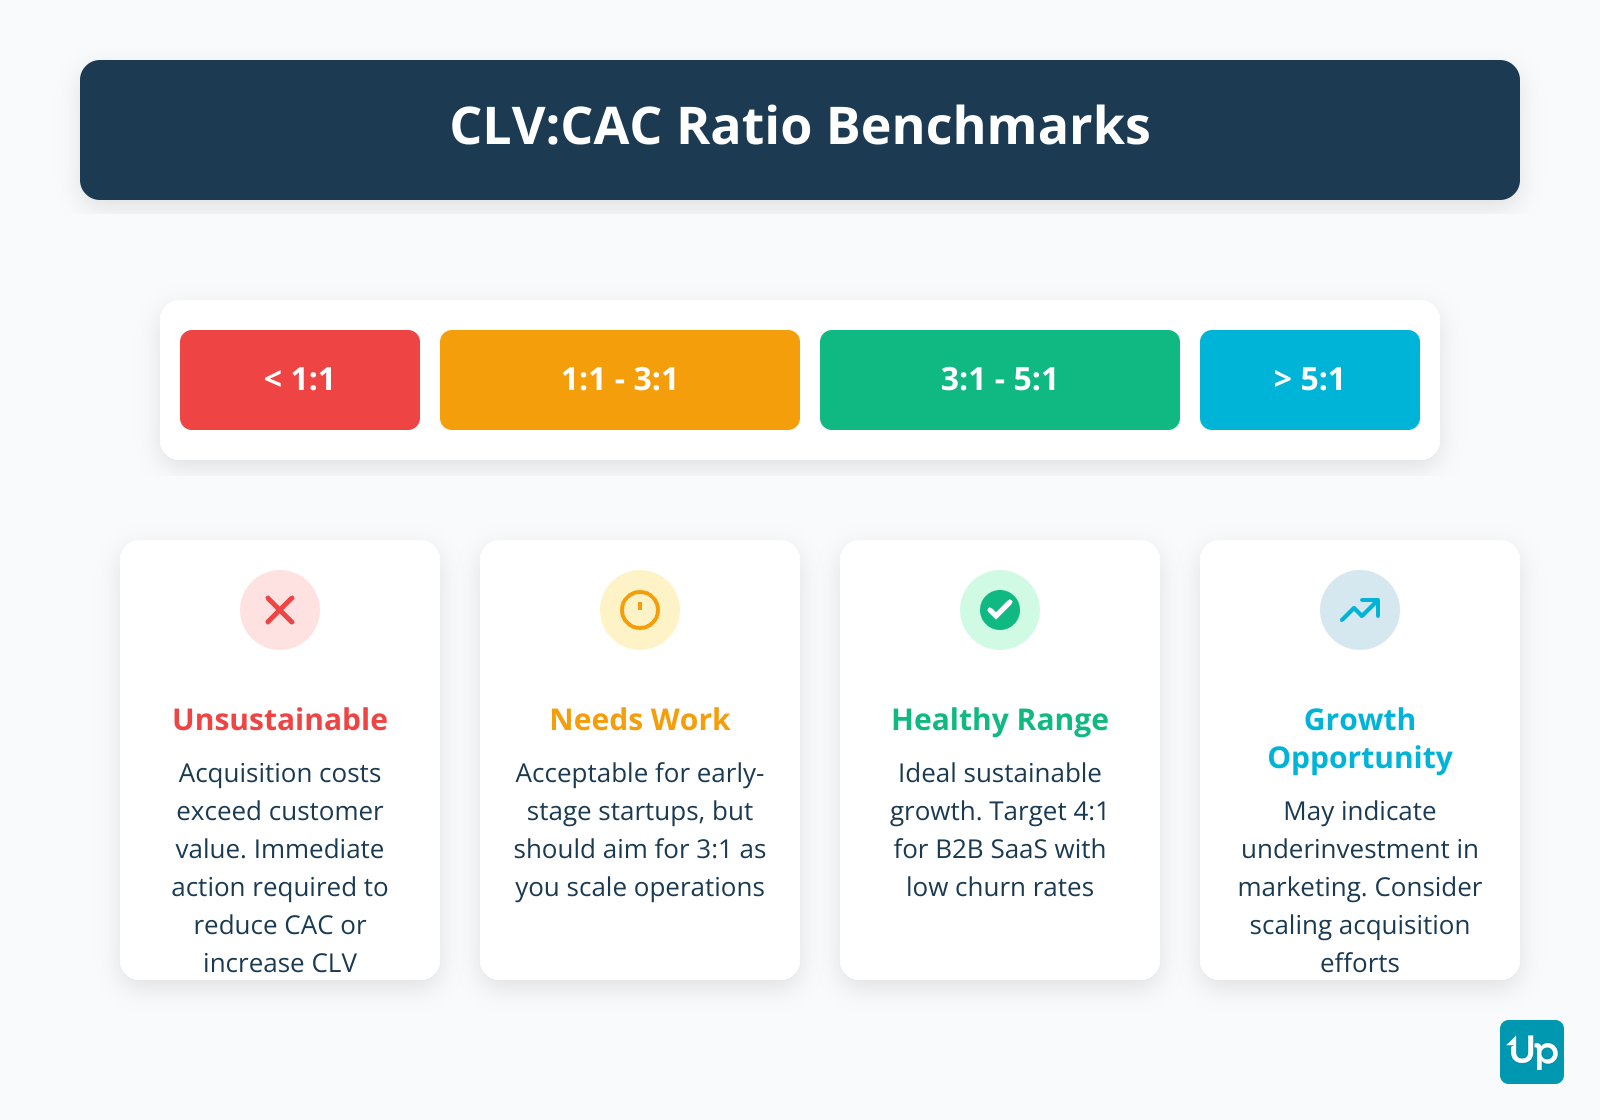
Customer Lifetime Value to Acquisition Cost Ratio
How does average deal size impact your strategy?
Average deal size impacts your strategy by helping you understand the value of your B2B lead generation efforts. It’s important to know how much revenue you’ll be able to make on each lead and how many leads you need to reach your sales goals. Analyzing the average deal size will also provide insight into what works well with certain qualified leads and which lead-generation strategies need improvement.
In addition, looking at the revenue generated with each closed sale can help businesses identify their biggest customers. This data can be used to modify lead generation activities to attract more customers similar to those top performers.
Though the average deal size is often overlooked as a B2B lead generation KPI, it can provide important insights into customer value and relationships. Larger average deal sizes are often associated with increased customer loyalty, larger orders, and higher profitability.
What is ROI?
Return on Investment (ROI) measures the overall profit generated from a marketing investment relative to its total cost. The formula is: Simple Marketing ROI = ((Sales Growth from Marketing – Marketing Investment) / Marketing Investment) × 100. ROI considers all costs, not just direct ad spend, including salaries, tool subscriptions, creative costs, and overhead. It is used for long-term strategic planning to determine if a marketing initiative is contributing to the company’s bottom line.
What is ROAS?
Return on Ad Spend (ROAS) measures the gross revenue generated for every dollar spent on advertising. The formula is: ROAS = (Total Revenue from Ad Campaign / Total Ad Spend). ROAS is ideal for short-term, tactical optimization of ad campaigns but does not account for other business costs like product manufacturing, salaries, or overhead. ROAS is a tactical metric focused purely on advertising, while ROI is a strategic metric that assesses overall profitability.
Channel-Specific Lead Generation KPIs
Different lead generation channels require different metrics to evaluate success. Tracking marketing channels is essential to determine their effectiveness and allocate budgets efficiently. Understanding channel-specific KPIs helps you optimize each strategy independently. Lead generation results can be improved by using tools like live chat and chatbots, which enable real-time and 24/7 engagement with prospects, answering questions and guiding them through the purchase process. Omnichannel attribution employs multi-touch attribution models to accurately credit leads across integrated marketing sequences. Centralizing lead tracking with a CRM allows you to monitor leads from the first touchpoint to the closed deal.
What are outbound campaign KPIs?
Outbound campaign KPIs measure the effectiveness of interrupting a prospect’s day with a relevant message through channels like cold calling and emailing. Key metrics include Reply Rate, which is the percentage of prospects who respond to a cold email sequence. Recent data indicates a decline in cold email effectiveness, with an acceptable B2B cold email open rate between 15-25%, though the average dropped to 27.7% in 2024 from approximately 36% in 2023.
The average reply rate for cold emails is now between 1-5%, with one 2024 study pegging the average at 5.1%, down from 7% the prior year. A “good” reply rate is considered anything over 5%, with 10% being excellent. Highly personalized campaigns can see reply rates of 15-25%.
Meeting Booking Rate measures the percentage of outreach efforts that result in a scheduled meeting. Lead Quality Score is a score assigned to leads based on their fit with the Ideal Customer Profile and their engagement level.
What are inbound and content marketing KPIs?
Inbound and content marketing KPIs focus on the efficiency of converting audience interest into qualified leads. Generating leads through effective inbound and content marketing strategies is crucial for campaign success and understanding which channels are most effective. Key metrics include Marketing Qualified Leads (MQLs) and Sales Qualified Leads (SQLs), Lead-to-Customer Conversion Rate (with a good benchmark around 10-15%), and Cost Per Lead (CPL) calculated by dividing the total cost of a marketing campaign by the number of leads generated. A/B testing different lead magnets and landing page layouts can help optimize conversion rates.
B2B conversion rates by channel show paid search at 1.5%, organic social at 1.7%, paid social at 0.9%, and email marketing at 2.4%.
A Quick-Reference KPI Benchmark Table
Understanding what “good” looks like is essential for evaluating your performance. Below is a quick-reference table summarizing key benchmarks mentioned throughout this guide.
| KPI | Benchmark |
|---|---|
| MQL-to-SQL Conversion Rate | 13% (average), 31% (website), 24% (referrals) |
| CLV:CAC Ratio | 3:1 (healthy), 4:1 (B2B SaaS target) |
| Average CPL (Overall) | $237 |
| Average CPL (Organic) | $164 |
| Average CPL (Paid) | $310 |
| Average CPL (LinkedIn Ads) | $408 |
| Traffic-to-Lead Rate (B2B) | 1-3% |
| Lead Response Time | Under 5 minutes (ideal) |
| Meeting Show-Up Rate | 83% |
| Cold Email Reply Rate | 1-5% (5.1% average in 2024) |
| Lead-to-Customer Rate (Inbound) | 10-15% |
These benchmarks provide a starting point for evaluating your performance. Remember that industry, company size, and sales cycle length can significantly impact these numbers.
How to Build Your Lead Generation KPI Dashboard
A lead generation KPI dashboard should be structured by funnel stage to provide a clear view of performance from initial contact to conversion. The structure should be divided into Top-of-Funnel (TOFU), Middle-of-Funnel (MOFU), and Bottom-of-Funnel (BOFU).
Top-of-Funnel (TOFU) – Awareness & Traffic includes Website Traffic (segmented by source), Impressions, Reach, Social Media Engagement, and Click-Through Rate (CTR).
Middle-of-Funnel (MOFU) – Consideration & Lead Capture includes Landing Page Conversion Rate, Number of Leads/Contacts, Cost Per Lead (CPL), Marketing Qualified Leads (MQLs), and Lead-to-MQL Conversion Rate.
Bottom-of-Funnel (BOFU) – Conversion & Revenue includes Sales Qualified Leads (SQLs), MQL-to-SQL Conversion Rate, Customer Acquisition Cost (CAC), Deal Win Rate, Lead-to-Customer Rate, and Return on Investment (ROI).
HubSpot allows teams to build detailed lead generation dashboards to monitor the entire customer journey using Customer Journey Reports to track conversion rates between key lifecycle stages like Marketing Qualified Leads and Sales Qualified Leads, with customizable dashboards featuring real-time data on KPIs such as lead sources, conversion rates, and customer acquisition cost. Salesforce Sales Cloud provides Lead Generation KPIs tracking including Lead Response Time, Follow-up Contact Rate, Total Inbound Leads, Lead-to-Opportunity Ratio, and Lead Conversion Rate, with pre-built dashboards like the “Leads Overview Dashboard.”
How to Choose the Right KPIs for Your Business
The right lead generation KPIs can help you understand how well your marketing efforts are creating prospects that convert. By tracking critical metrics, such as cost per lead or customer lifetime value, you can identify which tactics are working and what improvements need to be made to drive more qualified leads. Focusing on important lead generation metrics allows you to optimize your strategies, better understand customer behavior, and improve conversion rates and revenue growth.
When selecting KPIs, ensure they are defined as Specific, Measurable, Achievable, Relevant, and Time-bound.
Below are some best practices for choosing the right KPIs for lead generation to meet your sales and marketing goals.
Who is your target audience?
Your target audience is defined by creating a customer persona and zeroing in on the specific prospects most likely to convert. Defining your customer persona and zeroing in on your target audience is important when developing lead generation KPIs. This helps you decide where to focus your efforts and allows you to create content that engages them effectively. By clearly understanding your ideal customers, you can determine which KPIs should be tracked to find those most likely to convert.
What is your pricing model?
Your pricing model influences which strategies you use to attract prospects and significantly affects how many qualified leads you acquire and their quality. One of the primary metrics to consider in developing your lead generation KPIs is pricing, which will influence which strategies you use to attract prospects. As you devise your plan, don’t neglect the impact of different pricing structures, as this can significantly affect how many qualified leads you acquire and their quality. An effective pricing model will ensure you target the right consumer segments and maximize your lead conversion rate. Take your time to research these factors thoroughly before deciding how to use your marketing budget.
Are you targeting B2C or B2B customers?
You need to tailor your KPIs based on whether you’re targeting B2C or B2B customers because they have different sales cycles and conversion patterns. When it comes to lead generation, one size does not fit all. Different businesses target different customers, so having well-crafted KPIs tailored to your target audience can be the difference between successful lead generation and little to no conversion. Business-to-consumer (B2C) companies usually pursue shorter sales cycles and higher conversions.
Tracking lead generation KPIs geared towards short-term goals is their best bet. On the other hand, B2B lead generation campaigns tend to have more extended sales cycles, so monitoring lead generation metrics related to long-term objectives is more pertinent. The key is understanding your customers and knowing which KPIs to track.
UpLead: Your Engine for Hitting and Exceeding KPIs
UpLead’s robust lead generation and sales intelligence tool can skyrocket your lead generation efforts. You can confidently plan campaigns knowing UpLead has a 95% data accuracy guarantee. An effective lead generation tool allows your sales team to uncover more leads faster. By providing invaluable sales intelligence, these tools create more qualified prospects while better managing sales team resources.
By leveraging the platform’s vast database of over 180 million contacts, you can quickly identify prospects with the highest likelihood of engaging on UpLead. With the power of machine learning, UpLead helps you make smarter decisions quickly to build your company’s lead generation initiatives to exceed your established key performance indicators.
UpLead’s most prominent features pave the way for enhanced lead generation success, including:
- Guaranteed 95% data accuracy on all leads
- Search over 16,000 technologies tracked to build an ideal tech stack
- Advanced search and filter capabilities
- Access to competitor intelligence
When you need reliable sales intelligence without compromising exceptional quality, reach for UpLead—the ultimate tool for lead generation success. Try the platform today and see why UpLead is best-in-class at delivering premier-quality leads.
Frequently Asked Questions
Below are a few of the most frequently asked questions about lead generation KPIs.
What are the KPIs for lead generation?
KPIs measure performance against pre-defined objectives and provide essential insights into how well your sales process achieves its goals. Lead generation metrics may include sales volume, lead conversion rate, customer acquisition cost, lead source, or quality of customers acquired.
What are KPI leading indicators?
Leading indicators are the KPIs that help measure progress towards those goals and can signal if corrective action is necessary for achieving those goals in the future. They encompass the precursors to outcomes and provide insights into how activities can be adjusted to increase performance or address deficiencies before negatively affecting overall results. By regularly reporting your leading indicators, you can get an early indication of any upcoming changes in monthly recurring revenue, performance levels, trends, customer loyalty, satisfaction, and potential roadblocks before they hit.
How do you measure lead generation?
When collecting lead generation data, key components to analyze include the total number of leads, cost per lead, qualification rate, conversion rate, and ROI.
What is a good MQL-to-SQL conversion rate?
A good MQL-to-SQL conversion rate is around 13% on average, though this varies significantly by lead source. Websites achieve approximately 31%, referrals 24%, and LinkedIn leads average 33.33%.
What is the ideal lead response time?
The ideal lead response time is under 5 minutes. Companies responding within 5 minutes are 100 times more likely to connect with a lead compared to those waiting 30 minutes. Responding within the first minute can boost conversions by 391%.
From Metrics to Momentum: Key Takeaways
Lead generation success is becoming increasingly vital for businesses of all sizes, and utilizing KPIs to measure effectiveness is a great way to track performance. As you look at lead generation, there are several indicators you’ll want to remain mindful of. These include website traffic-to-lead conversion rate, customer acquisition cost, MQL-to-SQL conversion rate, and lead response time for both outbound and inbound strategies. By understanding these lead generation metrics and ensuring they stay within the desired margins, you can be sure your marketing and sales efforts are running fluidly and producing the best possible results. A great help in this endeavor is UpLead, which provides high-quality leads that give your team an edge. UpLead helps your sales reps master their lead generation objectives while surpassing KPIs.