

TAM, SAM, and SOM measure market size at three nested levels, from the total demand for a category down to the share a business can realistically win in the next planning period. This guide defines all three, gives a labeled bottom-up calculation, and names where the underlying numbers actually come from.
Picture three circles, one inside the next. SOM sits inside SAM, and SAM sits inside the outer circle, TAM. Investors use the three layers to judge how big an opportunity is and how credible a company’s near-term plan is. Operators use them to size a go-to-market plan and decide whether a new segment is worth entering.
What Are TAM, SAM, and SOM?
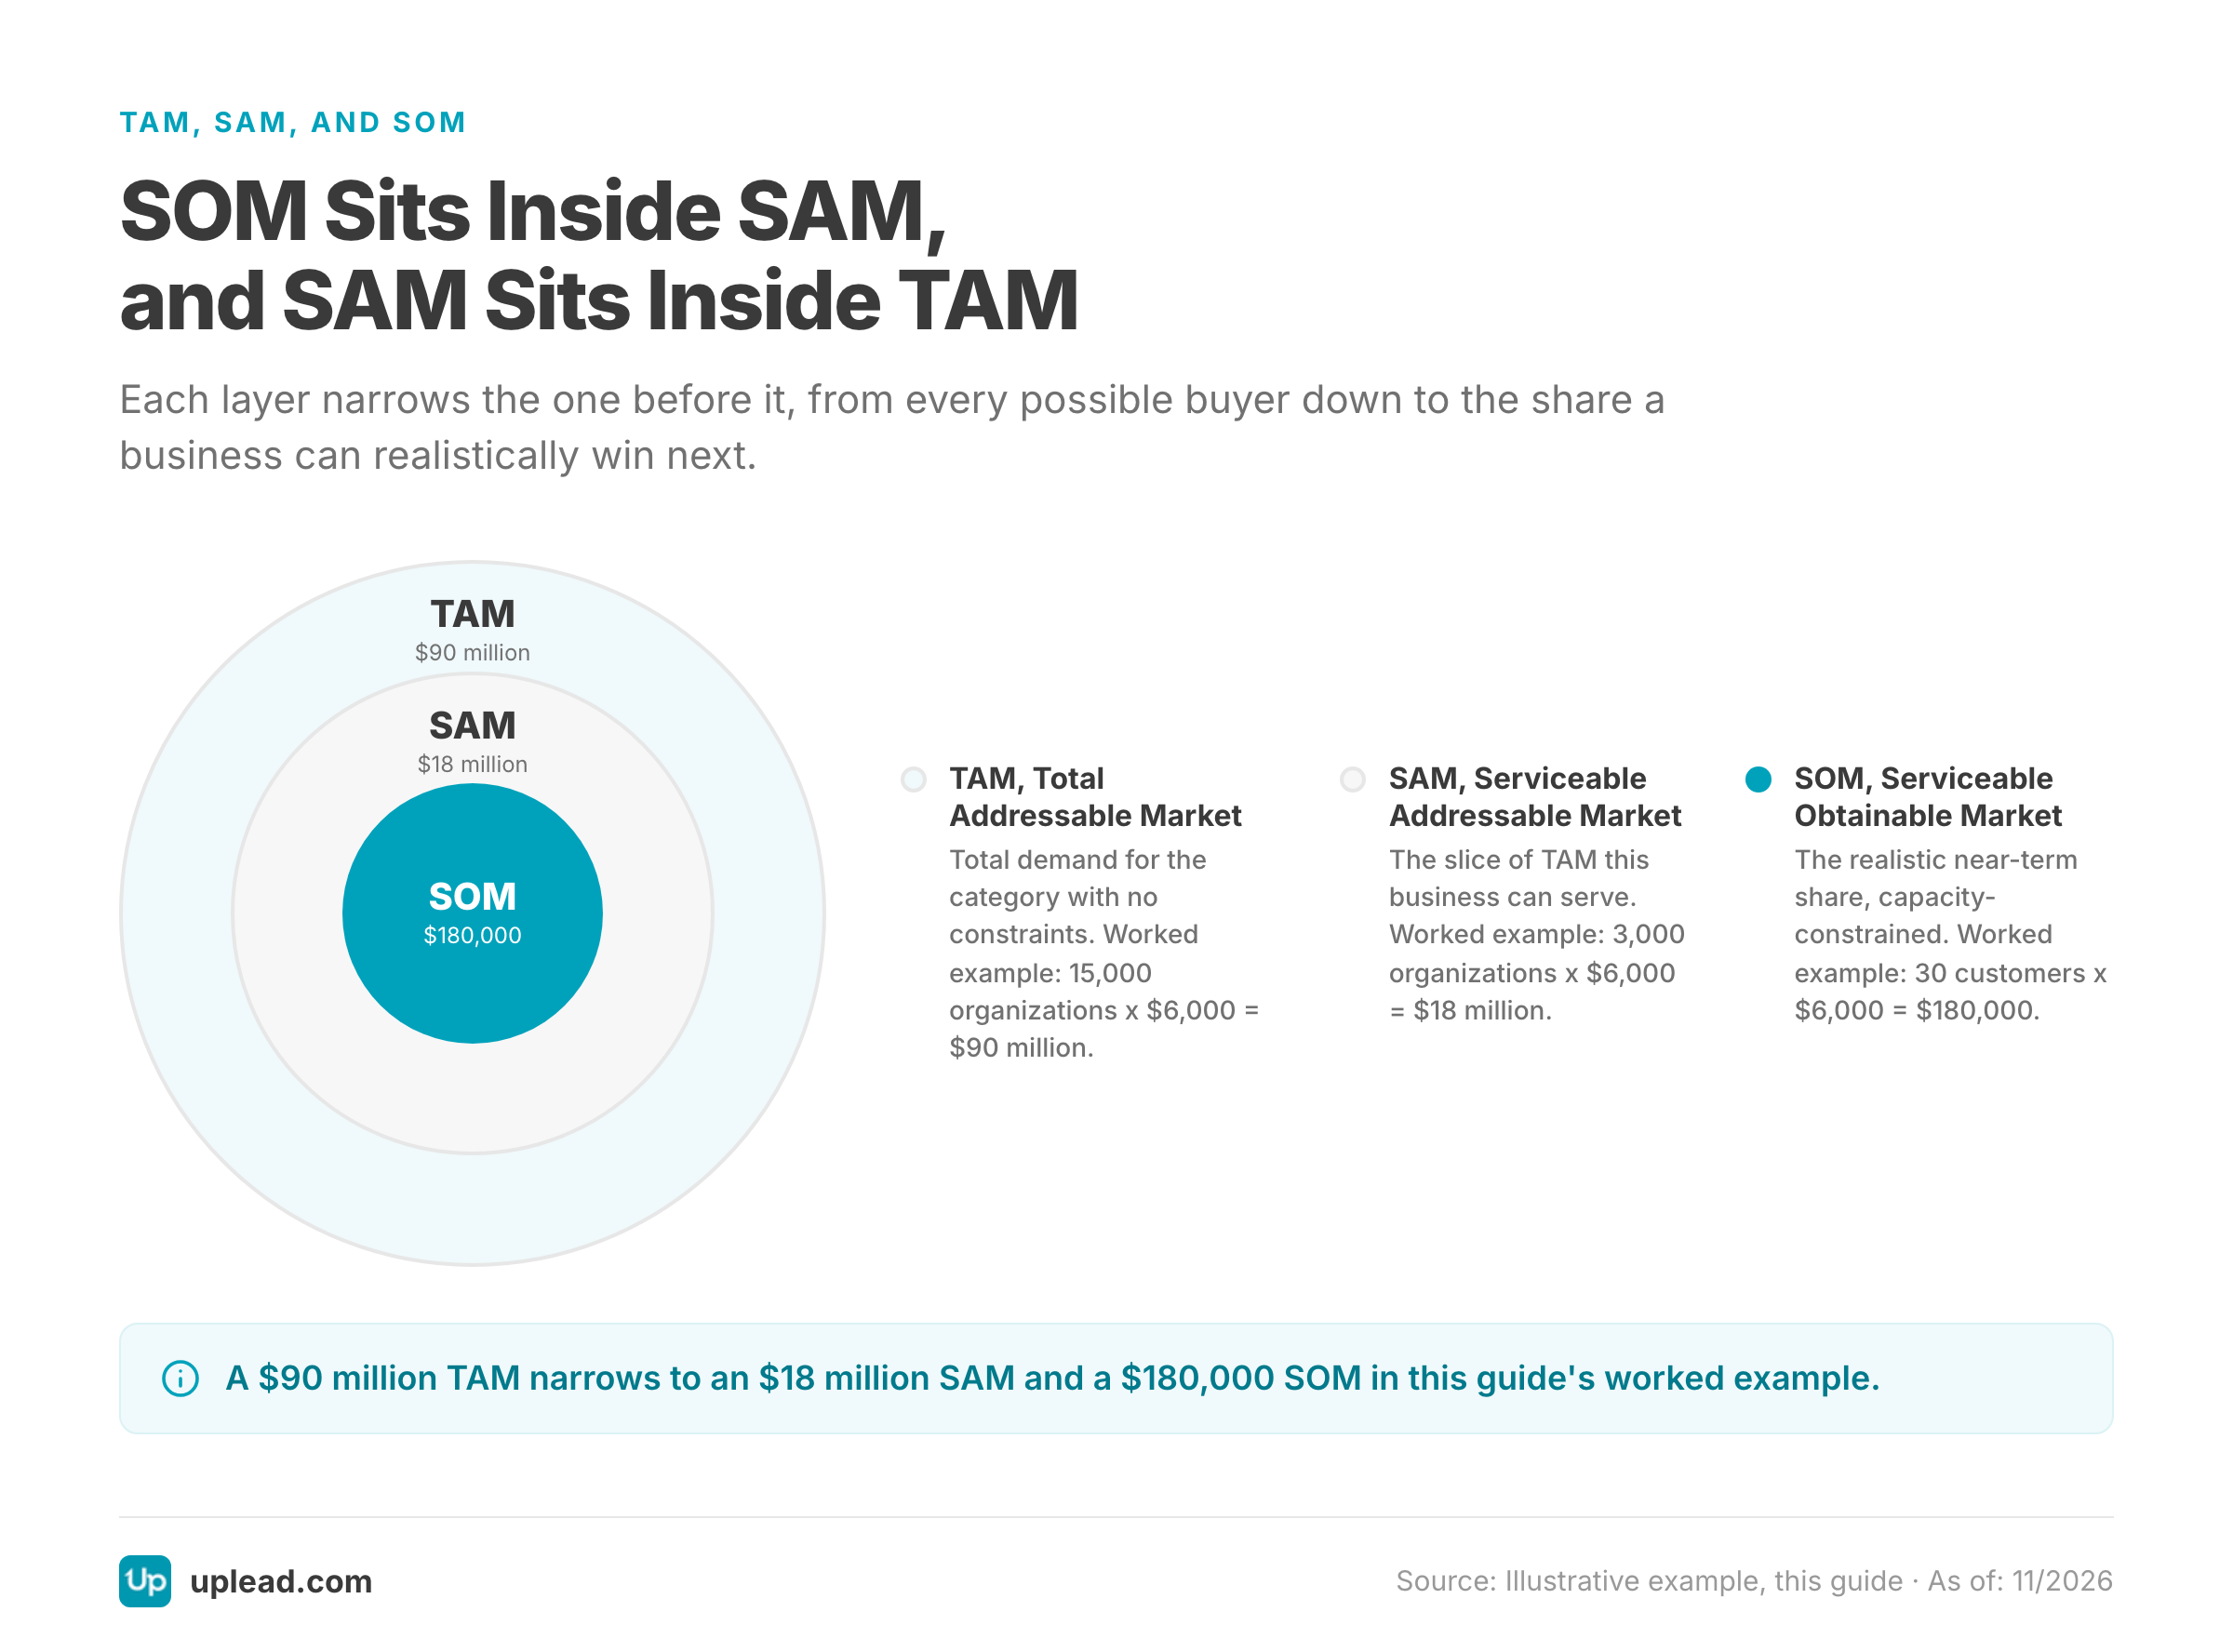
TAM (Total Addressable Market) is the total revenue a product category could generate if one company captured every buyer with no competition and no constraints. SAM (Serviceable Addressable Market) narrows that down to the portion a specific business can actually reach and serve, based on its product scope and its pricing. SOM (Serviceable Obtainable Market) narrows SAM further, down to the share that business can realistically capture in a defined period. That share is based on its sales and delivery capacity.
- TAM: every potential buyer in the category, with no limits
- SAM: the buyers this specific business could serve, given its scope
- SOM: the buyers this business can realistically win in the next planning period
Each layer answers a different question. TAM shows how big the category is. SAM shows how much of it fits the business. SOM shows what a near-term sales and delivery plan can actually produce. Stripe’s own guide to market sizing frames the same three layers the same way: TAM as the full revenue opportunity, SAM as the part a company can serve, and SOM as the part it can realistically win early on.
Why TAM, SAM, and SOM Matter for Go-to-Market Planning
Resource allocation improves once a company knows which slice of the market it’s actually chasing. A large TAM doesn’t change how many sales reps or support staff a company needs this year. SAM and SOM do.
Fundraising conversations get sharper, too. Investors read TAM as a ceiling on the opportunity. SAM and SOM get read as a test of whether the go-to-market plan is grounded in a specific, reachable set of buyers rather than a borrowed industry statistic; Carta’s market-sizing guide makes the same point directly, noting that targeting a large market alone is not enough without a credible plan to capture a meaningful share of it.
Go-to-market targeting also gets more precise. Once SAM defines which industries are worth serving, go-to-market teams can build territory plans around that same definition instead of chasing the entire TAM, as part of a broader go-to-market strategy.
Total Addressable Market (TAM): Definition and Formula
TAM equals the total number of potential buying organizations multiplied by the average annual revenue per organization. In its simplest bottom-up form: TAM = total eligible buyers x average annual value per buyer.
Two methods produce a TAM figure. A top-down approach starts with a published industry or analyst estimate for the broader category and narrows it with assumptions about the relevant share. A bottom-up approach starts from a count of actual eligible organizations and multiplies that count by a realistic price or revenue figure. Bottom-up numbers are easier to defend, since every input traces back to a count and a price rather than a borrowed industry-report figure. The scale varies widely by business: Salesforce’s own published example for a manufacturing software company puts TAM at roughly $6 billion and SAM at roughly $2 billion, using this same formula.
One caution applies to marketplaces and other multi-sided platforms. Gross transaction value flowing through the platform is not the same figure as the platform’s own revenue, and counting both as TAM in a single calculation double-counts the opportunity.
Serviceable Addressable Market (SAM): Narrowing the Opportunity
SAM takes the TAM population and applies the filters that reflect what the business can actually sell and support today. Typical filters narrow by:
- industry or sub-industry fit
- company size, measured by employee count or revenue band
- geography and language
- required technology or workflow
- buyer type, such as whether an organization has a dedicated budget holder for the category
SAM is almost always a meaningfully smaller number than TAM, and that’s the point. A company that reports its SAM as nearly equal to its TAM has usually skipped a filter that a real buyer would apply before purchasing. Stripe’s market-sizing guide names confusing TAM with SAM, along with inflating TAM, as one of the most common estimation errors it sees.
Serviceable Obtainable Market (SOM): Your Realistic Share
SOM is the portion of SAM a business can realistically capture in a stated period, such as the next twelve months. It isn’t a fixed percentage of SAM pulled out of thin air. Instead, it’s set by how many qualified buyers a specific channel can reach and how many new customers the team can onboard without breaking delivery quality.
A company with a large SAM but a small sales team will have a modest SOM, no matter how big the addressable market looks on paper. SOM needs a route to the customer and a plan to deliver on the sale, not just an assumed capture rate. Corporate Finance Institute describes the same idea: SOM should come from a realistic capture share or a historical market-share percentage applied to SAM, not an arbitrary guess.
TAM vs. SAM vs. SOM at a Glance
| Layer | Definition | Typical Formula | Typical Data Source | Example Figure |
|---|---|---|---|---|
| TAM | Total demand for the category with no constraints | Eligible organizations x average annual value | Firmographic counts and public business-count statistics | 15,000 orgs x $6,000 = $90 million |
| SAM | The slice of TAM this business can serve | Filtered organization count x average annual value | Firmographic filters: industry, size, geography, technographic fit | 3,000 orgs x $6,000 = $18 million |
| SOM | The realistic near-term share, capacity-constrained | Reachable prospects carried through a sales funnel to closed customers | Outbound and inbound channel capacity; onboarding capacity | 30 customers x $6,000 = $180,000 |
How to Calculate TAM, SAM, and SOM: A Bottom-Up Example
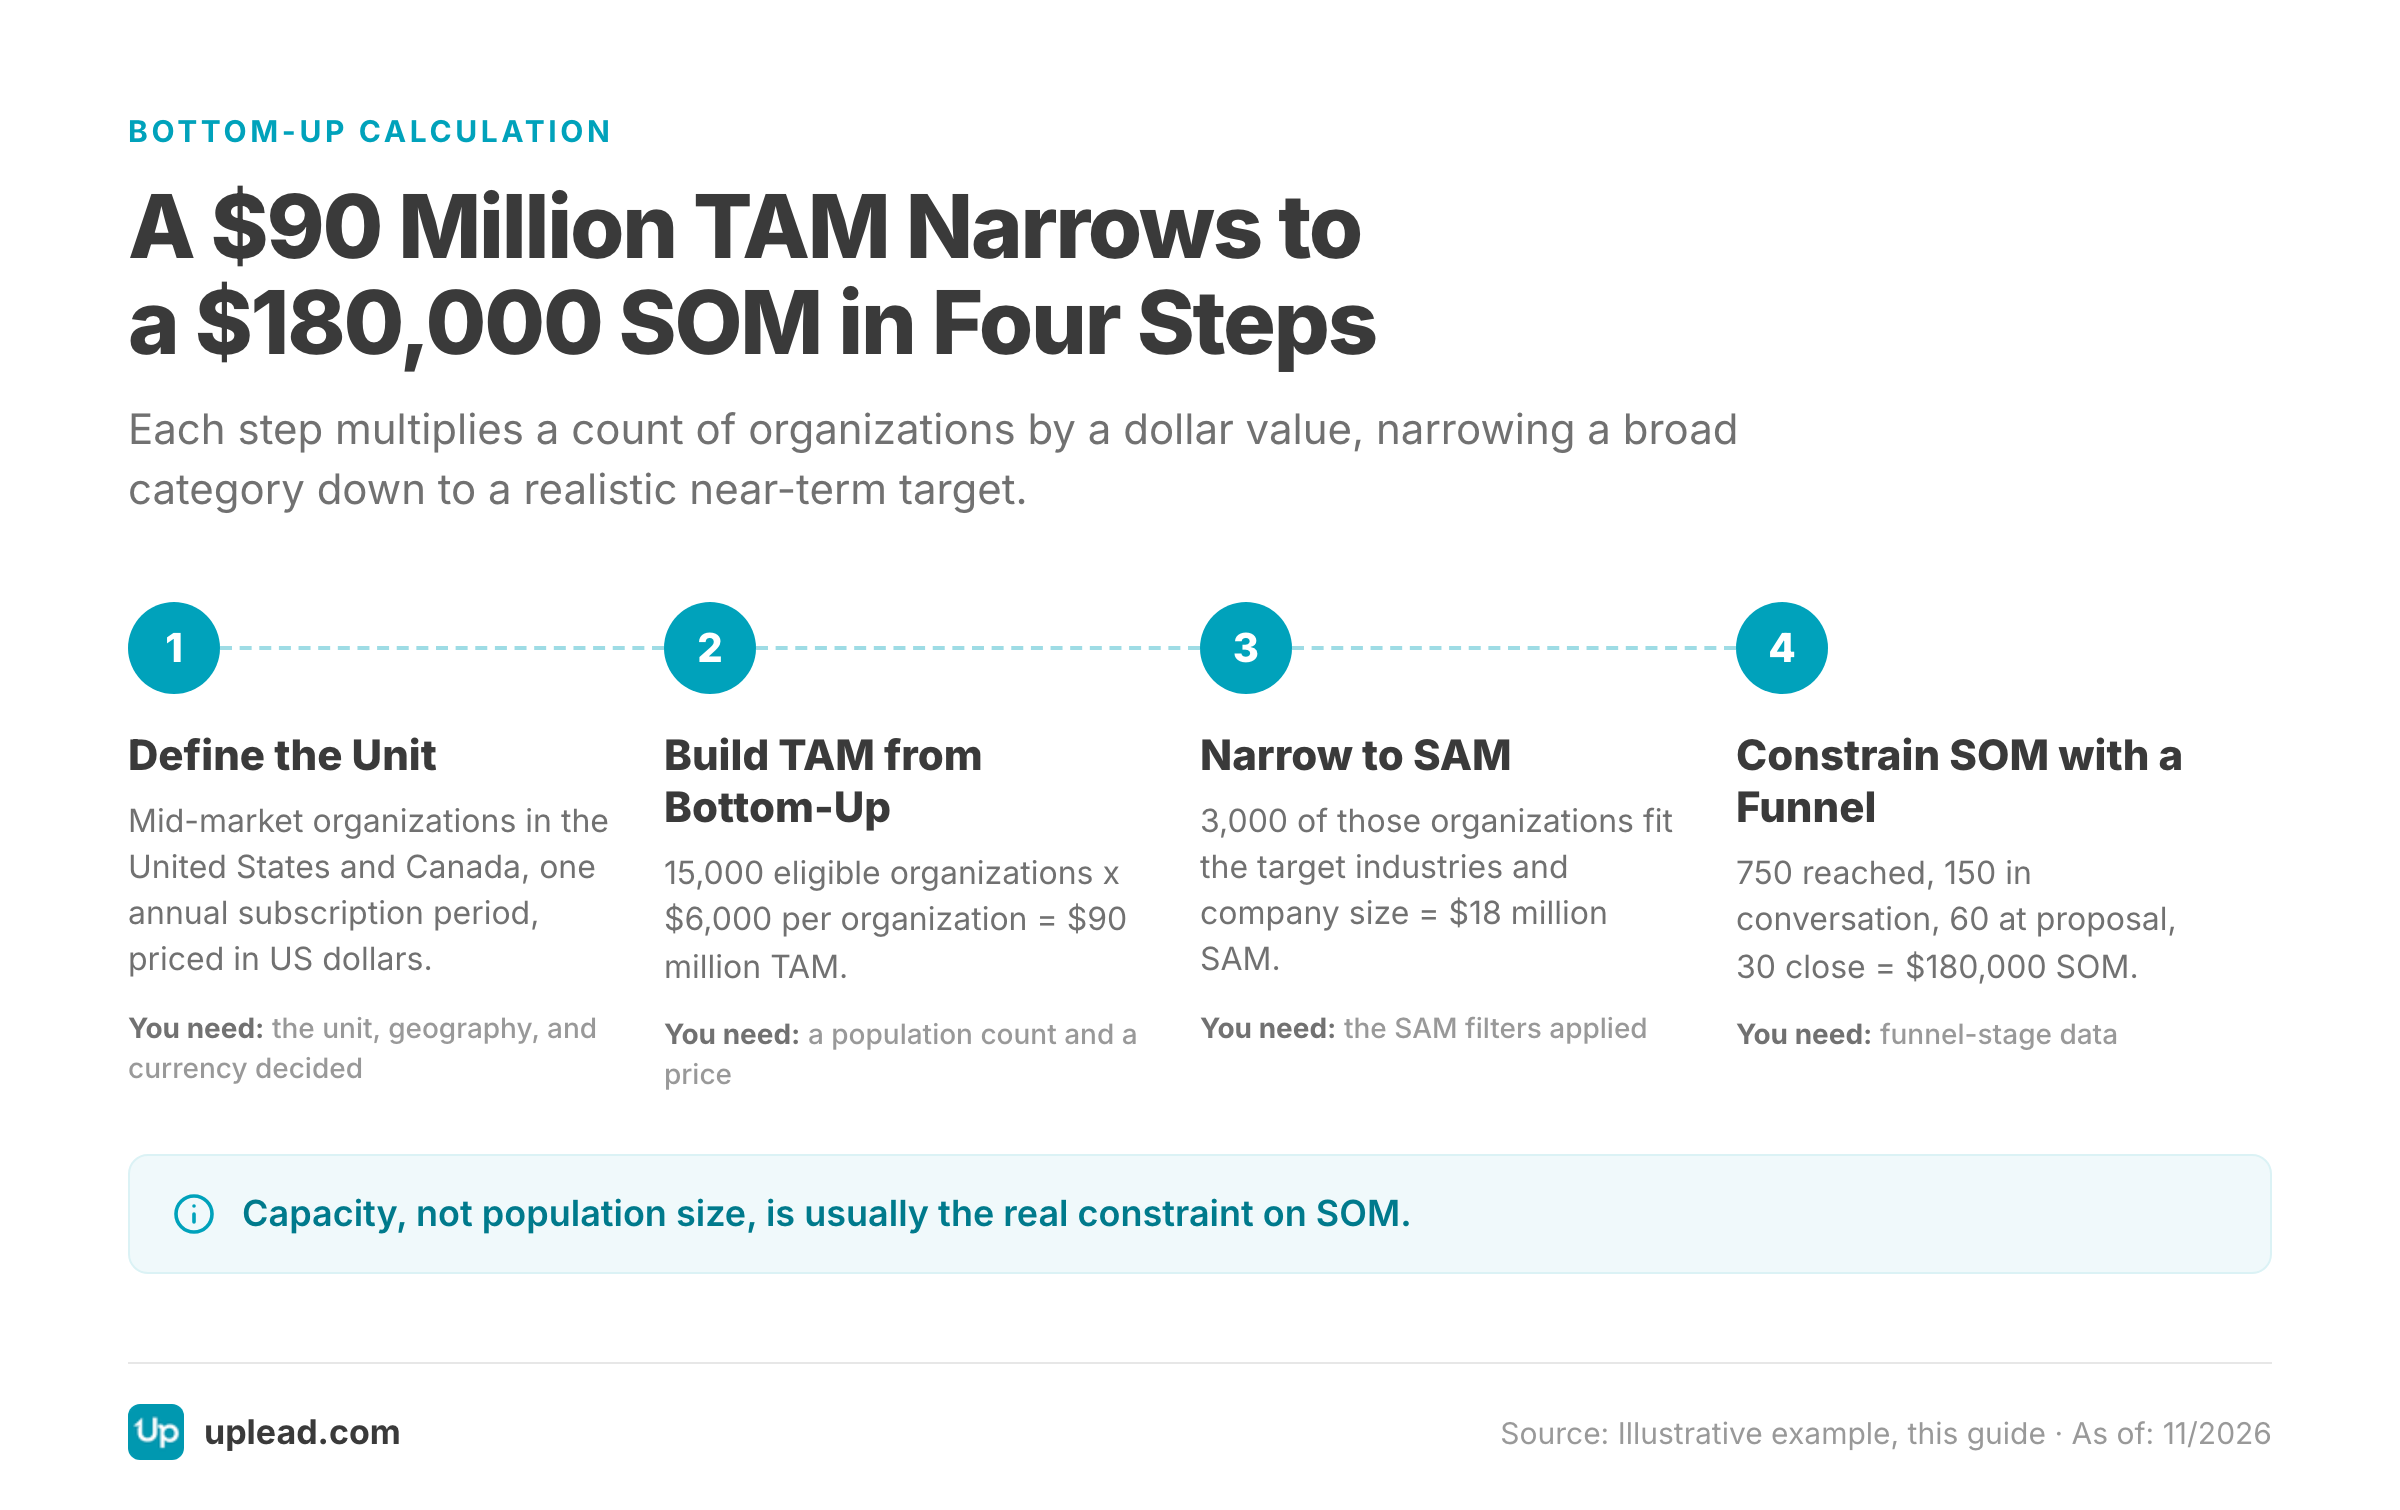
The bottom-up formula starts simple: eligible organizations multiplied by average annual value per organization. The calculation below builds step by step, using stated units and clearly labeled, hypothetical planning figures.
Step 1: Define the Unit and Scope
Before multiplying anything, state exactly what is being counted: which organizations, in which geography, over which period, in which currency. This example counts mid-market organizations in the United States and Canada, in a single annual subscription period, priced in US dollars. A common sizing mistake is mixing organization counts with transaction counts without converting between them; the mistakes section below covers that in more detail.
Step 2: Build TAM from the Bottom Up
Assume a product category with 15,000 eligible organizations in the United States and Canada, and an average annual subscription value of $6,000 per organization once a company adopts the category. In a real exercise, a figure like 15,000 would come from a named source rather than a guess; the U.S. Census Bureau’s County Business Patterns program publishes establishment counts by industry and employee-size class and is a common public starting point.
Formula: TAM = 15,000 organizations x $6,000 = $90 million
Step 3: Narrow to SAM
Apply the filters the business can actually serve today: mid-market company size and specific target industries, limited to English-language markets. Of the 15,000 organizations in the TAM, 3,000 fit that narrower profile.
Formula: SAM = 3,000 organizations x $6,000 = $18 million
Step 4: Constrain SOM with a Reachable Funnel
Instead of assuming a flat percentage of SAM, build SOM from what the sales and marketing channel can actually reach and convert over the next twelve months.
- 750 of the 3,000 SAM organizations can realistically be reached through outbound and inbound channels this year
- 150 of those enter a real sales conversation
- 60 reach a proposal stage
- 30 close as paying customers
SOM = 30 organizations x $6,000 = $180,000 in annualized new revenue
It helps to test one assumption at a time. The average contract value drives SOM directly: raising it from $6,000 to $7,500 with the same 30 closes lifts SOM to $225,000. Lowering it to $4,500 drops SOM to $135,000 instead. Changing the organization count barely moves SOM at all if the sales team’s onboarding capacity, not the population size, is the real limit. That’s usually the most useful finding in the whole exercise: the constraint on SOM is often capacity, not market size.
Where the Numbers Come From: Sourcing Your Bottom-Up Inputs
The hardest part of a bottom-up calculation is rarely the arithmetic. Finding a defensible count of eligible organizations to start from is usually the harder task. A few categories of input get used together:
- industry classification, using SIC/NAICS-style codes or a comparable category taxonomy
- company size bands, usually employee count or revenue range
- geography, down to country, state, or metro area depending on how localized the buying decision is
- technographic signals, such as whether an organization already uses a related tool
Public business-count statistics, such as government business-register data, can anchor the outer TAM population for some categories. For most B2B sizing work, though, the practical starting point is a company and contact database that already carries these firmographic attributes, since it lets a team pull a live count filtered by industry and size instead of estimating that count by hand. UpLead’s own database works this way: it exists to make exactly this kind of firmographic filtering fast, which is the same filtering this calculation depends on.
Whatever the source, record it. A bottom-up estimate that lists its population source and its filters can be checked and updated later. One that cannot be traced back to a source is simply a guess with a dollar sign in front of it.
Common Mistakes When Sizing TAM, SAM, and SOM
- Filters get multiplied as if they are independent. Company size often overlaps with required technology and industry fit. Guessed percentages multiplied together compound uncertainty instead of narrowing it accurately. Check a sample of real organizations before stacking filters.
- SOM gets treated as a fixed percentage of SAM. A flat “we’ll capture 10% of SAM” assumption ignores sales capacity and how long the buying cycle actually takes. Build SOM from a funnel instead.
- Market size gets confused with a sales forecast. A sales forecast describes what the team actually expects to close and when, ramp time included; a market estimate describes an opportunity under stated assumptions. A large TAM does not make a forecast more credible.
- Units get mixed without converting them. Counting organizations in one step and transactions in another, without stating the conversion between them, produces a number that looks precise but cannot be checked.
What Is a Good TAM?
No single dollar figure makes a TAM “good” for every business, but the benchmarks venture investors and operators actually use are specific enough to be useful.
Venture-backed startups usually need to target a TAM of roughly $1 billion or more, since a venture fund’s return math depends on a handful of winners reaching outsized scale. Bootstrapped or niche businesses can run profitably in markets closer to $50 million to $300 million, where competition for the same pool of buyers is lighter.
What matters more than the number is whether it holds up against a bottom-up count. A TAM calculated from real eligible organizations, backed by a credible SAM and SOM, lands better with an investor than a larger figure pulled from a top-down industry report with no visible path to SAM or SOM.
Frequently asked questions
SAM stands for Serviceable Addressable Market. It’s the portion of the Total Addressable Market a specific business can realistically reach and serve, based on its product and its pricing, through the channels it actually uses. Most industry filters used to define SAM map to a standard classification system such as the North American Industry Classification System (NAICS) in the United States.
SOM, or Serviceable Obtainable Market, is the share of the Serviceable Addressable Market a business can realistically capture in a defined period. It’s limited by sales and delivery capacity rather than a fixed percentage of SAM; Salesforce’s own market-sizing guide defines it the same way, as the slice of SAM a business can realistically convert within a set timeframe.
Not on its own. Carta’s market-sizing guide treats a roughly $1 billion TAM as a venture-investor rule of thumb rather than a hard cutoff, and is explicit that targeting a large market alone is not enough without a credible plan to capture a meaningful share of it. A smaller, well-defined TAM with a clear bottom-up path to SAM and SOM usually carries more weight than an inflated top-down figure.
No. SAM is calculated as the percentage of TAM a business can reasonably expect to reach through its sales and marketing, so it is defined as a subset of TAM by construction. A SAM calculation that lands close to or larger than TAM usually means a filter was applied incorrectly, or the TAM population was defined too narrowly to begin with.
The arithmetic works with any assumptions, but the result is only as defensible as its inputs. A figure built from a real count of eligible organizations, filtered by industry, holds up better than a guess and can be checked later; that is also why guides built around this method, including the sourcing discipline described earlier in this article, stress recording the population source and the filters used.