If you’re building a sales team or planning your career in sales, understanding sales titles is critical. The landscape of sales roles has become more complex than ever, with dozens of titles like SDR, BDR, AE, and CSM creating confusion for both job seekers and hiring managers.
This confusion makes it hard to choose the right career path, attract the right talent, or structure your team for growth. You risk wasting time on the wrong roles or hiring the wrong people. That’s why we’ve created this definitive guide to demystify the entire sales world. We break down the complete sales hierarchy, detail each role’s responsibilities and salary, and map out clear career paths for 2025.
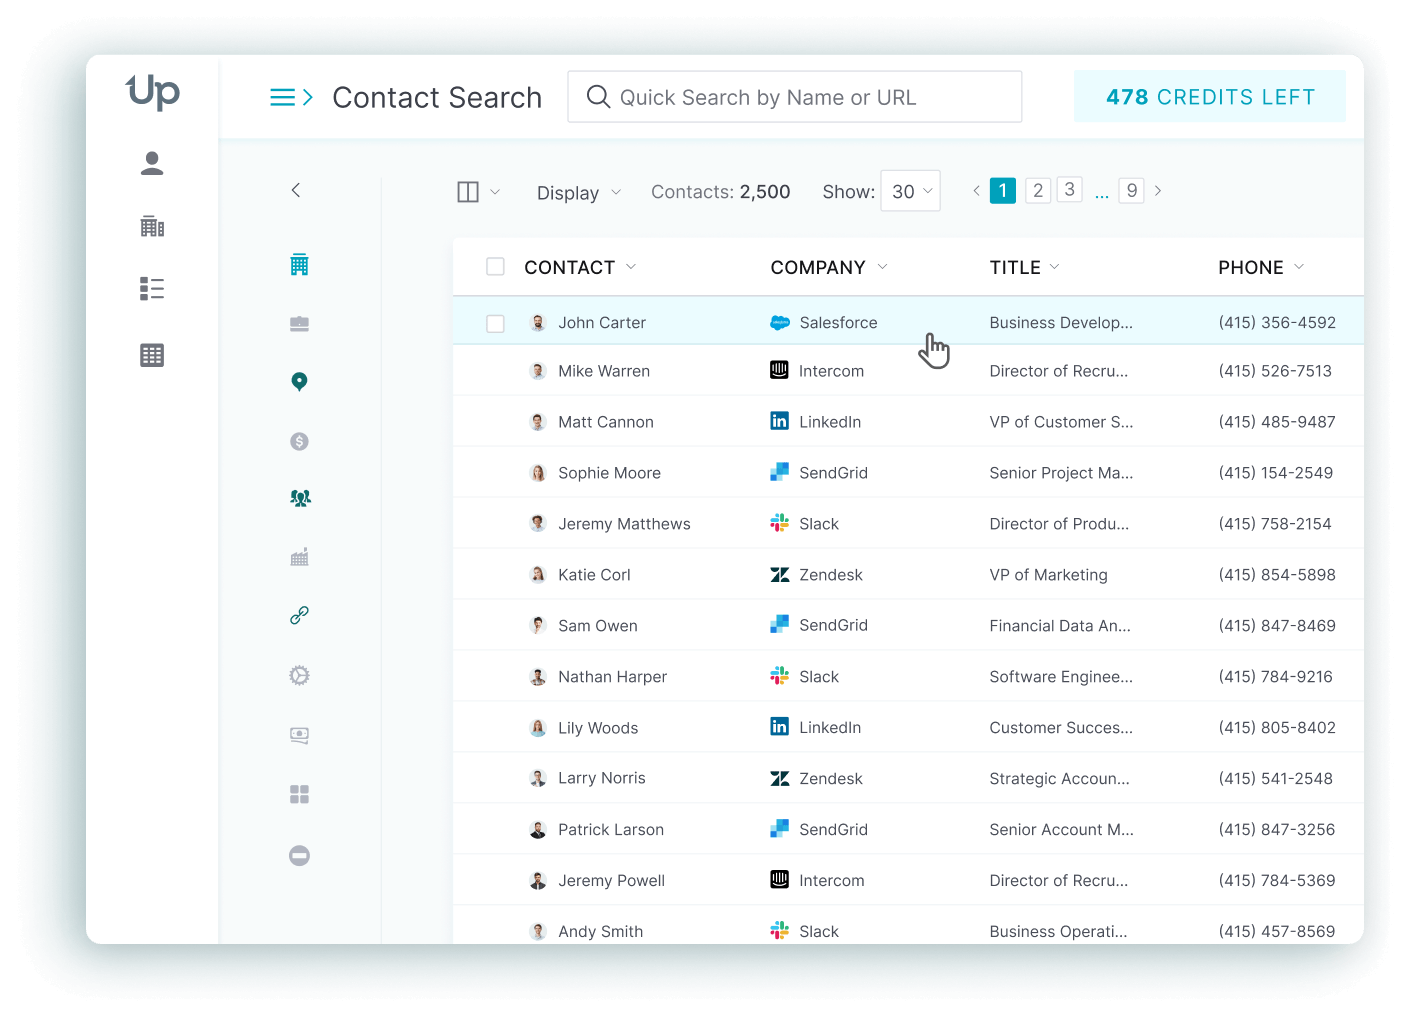
🔥 Quick Tip: Looking for sales leaders to reach out to? Try UpLead and get verified emails and mobile direct dials of Sales VPs, SDR managers, Account Executives, and more. First 5 leads are free.
Typical Sales Titles Hierarchy
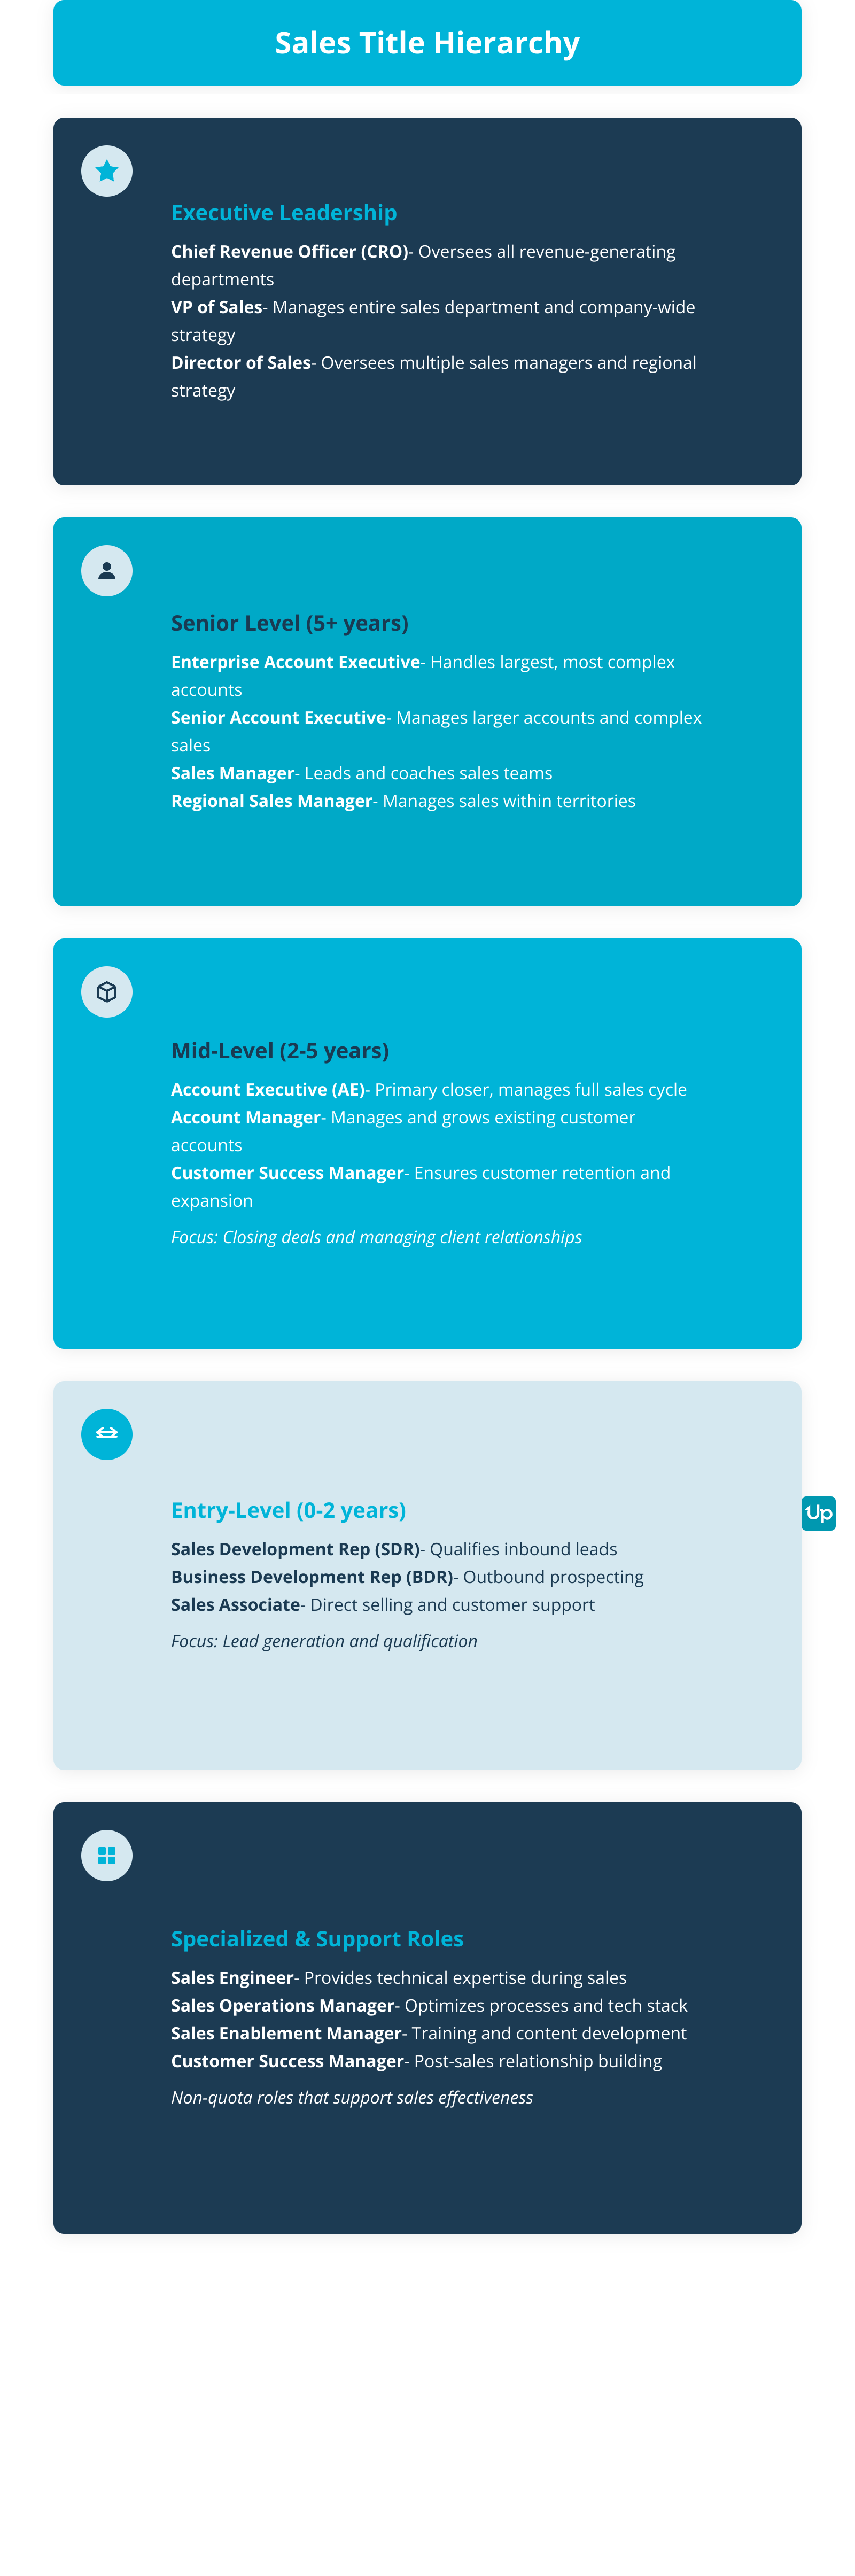
The typical sales title hierarchy is a structured progression of roles from entry-level positions focused on lead generation to executive leadership responsible for company-wide revenue strategy. Most sales organizations follow a four-tier structure with an additional category for specialized roles.
Within the sales world, there is a wide array of various sales titles, including both common sales titles and different sales job titles, each reflecting the diversity, hierarchy, and specialization found in modern sales teams. Understanding these titles and their corresponding responsibilities is crucial for building an effective sales team and aligning roles within the sales hierarchy. Sales positions are becoming increasingly specialized, and many new titles now omit the word ‘sales’ to emphasize a consultative, relationship-driven approach. The fast-growing, competitive nature of the SaaS industry has driven the creation of new sales titles and positions to address emerging needs. The evolving sales landscape has also led to the emergence of roles such as Revenue Enablement Manager and Sales Automation Specialist. As sales roles shift toward consultative selling, job titles continue to evolve to reflect this approach. Additionally, companies are increasingly creating slightly different titles to sound more modern and relevant, aligning with their values and culture.
Entry-Level (0-2 years experience) focuses on lead generation and qualification. Key roles include Sales Development Representative (SDR) who qualifies inbound leads from marketing efforts, Business Development Representative (BDR) who focuses on outbound prospecting through cold calls and emails, and Sales Associate who handles direct selling or supports other sales staff.
Mid-Level (2-5+ years experience) is responsible for closing deals and managing client relationships. This includes Account Executive (AE) as the primary closer who takes qualified leads from SDRs and BDRs, conducts demos, negotiates, and closes deals. Account Manager focuses on managing and retaining existing customer accounts with upselling and cross-selling goals. Customer Success Manager ensures customers successfully use the product for retention and expansion opportunities.
Senior-Level includes both Individual Contributor roles like Senior Account Executive handling larger and more complex accounts, and Enterprise Account Executive specializing in very large organizations with long sales cycles. Management roles include Sales Manager who manages teams of sales reps with responsibility for team performance and coaching, and Regional Sales Manager who manages sales activities within specific geographic territories.
Executive Leadership Level focuses on high-level strategy. Director of Sales oversees multiple sales managers or teams and sets regional or divisional sales strategy. Vice President of Sales manages the entire sales department and sets company-wide sales strategy. Chief Revenue Officer or Chief Sales Officer is the highest-level executive overseeing all revenue-generating departments including sales, marketing, and customer success.
Specialized and Support Roles include positions like Sales Engineer who provides technical expertise during the sales process, Sales Operations Manager who optimizes sales processes and manages the tech stack, Sales Enablement Manager who equips sales teams with training and content, and Customer Success Manager who focuses on post-sales relationship building.
This structure creates clear career progression paths. One path follows the individual contributor route from SDR to AE to Senior AE to Enterprise AE. Another path leads to management, moving from AE to Sales Manager to Director to VP of Sales.
Complete Sales Organization Hierarchy Structure
What Are Entry-Level Sales Titles?
Entry-level sales titles are the foundation of any sales organization. These roles focus on the top of the sales funnel, generating and qualifying leads that fuel the entire sales pipeline. Making initial contact with prospective buyers is crucial at this stage, as it sets the tone for moving leads through the sales process. Entry-level sales professionals often rely on phone calls and sales tools to connect with leads, build relationships, and manage their outreach efficiently. Most sales professionals start their careers in these positions, learning fundamental sales skills before advancing to closing roles.
Time management and optimism are key skills for productive sales professionals in entry-level sales roles.
Sales Development Representative (SDR)
A Sales Development Representative is an entry-level sales professional who manages the top of the sales funnel by qualifying inbound leads generated by marketing efforts. As an inbound sales rep, the SDR specializes in inbound sales by engaging leads who have already expressed interest, such as those who submit web inquiries or sign up for demos.
Inbound sales focuses on engaging potential customers who have proactively reached out to the company. SDRs play a key role in nurturing these hot inbound leads, improving response times, and guiding prospects through the sales funnel to conversion. SDRs act as the bridge between marketing and sales, ensuring that only qualified prospects reach the Account Executives.
What Are the Key Responsibilities of an SDR?
The key responsibilities of an SDR are managing the top of the sales funnel with a focus on lead qualification and nurturing. This includes prospecting and research to identify potential customers who fit the company’s ideal customer profile. SDRs engage with inbound leads from marketing to determine if they meet BANT criteria: Budget, Authority, Need, and Timeline.
They contact leads through phone, email, and social media to educate them on products and services. A critical responsibility is booking meetings by scheduling qualified appointments between prospects and Account Executives. SDRs also maintain accurate records of lead interactions and status updates in the CRM system.
What Skills Does an SDR Need?
An SDR needs hard skills like CRM proficiency with platforms like Salesforce or HubSpot, familiarity with sales enablement tools, and strong research skills to investigate companies and prospects. Soft skills are equally important: excellent verbal and written communication for prospect engagement, active listening to understand prospect needs rather than just pitching, and resilience to handle rejection with consistent follow-up.
Coachability is essential, as SDRs must be open to feedback and improvement. Organization and time management help juggle numerous leads and tasks. Curiosity drives genuine interest in learning about a prospect’s business and challenges.
What Is the Average SDR Salary and OTE in 2025?
The average SDR salary and OTE in 2025 is $55,000 to $60,000 per year for base salary, with median On-Target Earnings of $85,000. The national average base pay for SDRs serves as a useful benchmark, helping candidates and employers compare compensation levels across the United States. Entry-level positions may start around $45,000, while senior SDRs can earn $65,000 or more as a base. Typical OTE ranges from $75,000 to $95,000 depending on experience, location, and company. Top performers at leading tech companies can exceed $100,000 in total compensation.
The compensation structure is split 65-70% base salary and 30-35% variable commission, with commission paid for setting qualified appointments or generating pipeline.
Business Development Representative (BDR)
A Business Development Representative (BDR), or business development rep, specializes in outbound sales by proactively reaching out to potential customers. While SDRs work with inbound leads, BDRs proactively seek out potential customers who haven’t yet engaged with the company.
The outbound sales approach involves generating new leads through direct outreach activities such as cold calling, emailing, and SMS, allowing BDRs to expand the company’s customer base by identifying and qualifying prospects.
What Are the Key Responsibilities of a BDR?
The key responsibilities of a BDR are outbound prospecting by proactively identifying and contacting potential new customers via cold calling, cold emailing, and social media outreach like LinkedIn. They conduct market research to identify new markets, industries, or company segments not yet tapped by the organization.
Lead generation is central to the role, building lists of potential clients and initiating contact to generate interest and create qualified leads. BDRs excel at relationship building, nurturing initial relationships with potential customers, understanding their needs, and positioning the company as a potential solution. Like SDRs, they set appointments by scheduling introductory meetings between qualified prospects and Account Executives.
SDR vs BDR Key Differences
What Skills Does a BDR Need and How Do They Differ From an SDR?
A BDR needs skills that differ from an SDR primarily in their focus on the sales funnel. SDRs typically focus on qualifying inbound leads, while BDRs focus on generating new business through outbound prospecting. The core difference is the lead source: SDRs work with prospects who already showed interest by interacting with company marketing content, while BDRs proactively seek new opportunities and create interest where none existed before.
BDRs require stronger emphasis on strategic prospecting with the ability to research and identify untapped markets and build strategic outreach plans. They need high levels of self-motivation and resilience for cold outreach and handling rejection. A consultative approach is critical, as engaging cold leads requires a more relationship-focused method to build trust quickly.
What Is the Average BDR Salary and OTE in 2025?
The average BDR salary and OTE in 2025 is approximately $59,000 per year for base salary, ranging from $51,000 for entry-level to over $93,000 for senior roles with 7+ years of experience. The national average base pay for BDRs serves as a useful benchmark, helping to compare compensation levels across different regions and companies. Average total compensation (OTE) is approximately $91,805, with median OTE around $83,000. Top performers can earn over $130,000. The compensation split is often between 60/40 and 70/30 base to variable.
Sales Associate
A Sales Associate is a general entry-level sales position often found in retail or direct sales environments. Sales Associates play a key role in maintaining relationships with existing customers to ensure customer satisfaction and encourage repeat business. This role focuses on direct customer interaction, providing product information, and completing transactions.
What Are the Key Responsibilities of a Sales Associate?
The key responsibilities of a Sales Associate are greeting customers and creating a welcoming atmosphere to ensure a positive shopping experience. They assist customers by understanding their needs, answering questions, and recommending suitable products or services. Processing sales transactions accurately and efficiently using Point of Sale (POS) systems is a core duty, including handling payments, returns, and exchanges.
Maintaining a clean, organized, and visually appealing sales floor by restocking shelves and arranging product displays is part of the daily routine. Sales Associates stay informed about products, services, current promotions, and company policies to provide accurate information to customers. They collaborate with team members to meet or exceed individual and team sales targets and assist with inventory management such as conducting stock counts and reporting discrepancies.
What Skills Does a Sales Associate Need?
A Sales Associate needs communication and interpersonal skills for interacting with a diverse range of customers and team members in a friendly and professional manner. Customer service requires genuine interest in helping people and providing an excellent shopping experience to build rapport and loyalty. Product knowledge involves developing a deep understanding of the products and services offered to answer customer questions confidently.
Sales acumen and persuasion help convince customers to make a purchase, including upselling and cross-selling to meet sales goals. Active listening means listening carefully to understand a customer’s needs and challenges before offering a solution. Problem-solving allows quick and creative resolution of customer issues or complaints. Adaptability and multitasking help juggle multiple tasks such as helping several customers at once while managing other store duties. Basic math and cash handling ensure accurate transaction processing.
What Is the Average Sales Associate Salary and OTE in 2025?
The average Sales Associate salary and OTE in 2025 shows a wide range. Entry-level positions average around $45,046 per year, with the national average base pay for Sales Associates serving as a useful benchmark for comparing compensation across different regions and roles. The majority of salaries range between $37,000 (25th percentile) and $50,000 (75th percentile) annually. While specific OTE is less common for traditional retail associates, some sales-focused roles report average additional cash compensation of $35,015, leading to total compensation around $105,096, which likely applies to sales roles beyond entry-level retail.
What Are Mid-Level Sales Titles?
Mid-level sales titles represent the core revenue generators in any sales organization. These professionals are responsible for closing deals, managing client relationships, and overseeing client accounts to ensure satisfaction and retention. They often track payment statuses, update account information, and work to maintain strong customer relationships. Examples of mid-level sales positions include Account Executive (AE), Account Manager, and Sales Operations Manager. After proving success in entry-level roles, sales professionals advance to these positions where they carry individual quotas and are measured on revenue generation.
Account Executive (AE)
An Account Executive is the primary closer in a sales organization, responsible for managing the full sales cycle from qualified lead to closed deal. AEs take the leads generated and qualified by SDRs and BDRs, conduct product demonstrations, negotiate terms, and ultimately close new business. To succeed in this role, Account Executives need in-depth knowledge of the company’s products and must leverage sales tools to effectively manage the sales process.
What Are the Key Responsibilities of an Account Executive?
The key responsibilities of an Account Executive are pipeline and opportunity management, which involves identifying and qualifying sales leads through research, networking, and prospecting to build a robust sales pipeline. Client relationship management positions the AE as the primary point of contact for new and existing clients, building and maintaining strong, long-lasting relationships.
Closing deals is the core responsibility, which includes conducting sales presentations and product demonstrations, negotiating contracts and terms, and closing deals to meet or exceed sales quotas. Strategic planning involves developing and implementing sales strategies to acquire new customers and expand market reach within an assigned territory or set of accounts.
Internal collaboration means working with teams like marketing, customer support, and product to ensure client needs are met and solutions are delivered. Account Executives often participate in sales meetings to discuss strategy, review performance, and coordinate with other team members. Market analysis requires staying informed about industry trends, competitor activities, and market conditions to identify new opportunities and inform sales strategy.
What Skills Does an Account Executive Need?
An Account Executive needs sales and negotiation proficiency covering the entire sales process, from prospecting and pipeline management to negotiating favorable terms and closing deals. Relationship building is the ability to cultivate and maintain strong, trust-based relationships with clients to ensure satisfaction and long-term partnerships.
Communication and presentation skills include excellent verbal and written communication to clearly articulate value propositions and deliver compelling presentations to key stakeholders. Financial acumen means understanding business metrics, profit margins, and financial data to create budgets and offer sound advice to clients.
CRM software proficiency involves skill in using platforms like Salesforce to manage client data, track pipeline activity, and forecast sales. Problem-solving means identifying client challenges and developing effective, value-added solutions. Project and time management allow managing multiple accounts and projects while prioritizing tasks to meet deadlines and sales objectives.
What Is the Average Account Executive Salary, OTE, and Quota in 2025?
The average Account Executive salary, OTE, and quota in 2025 is approximately $100,000 to $104,000 for median base salary. The national average base pay for Account Executives serves as a useful benchmark, helping to compare compensation levels across different regions and companies. Those with less than 3 years of experience range from $75,000 to $110,000. The median On-Target Earnings is around $190,000 to $202,767, with some sources reporting average total compensation as high as $212,924.
OTE is often structured to be 100% of the base salary, meaning a $100,000 base would correspond to a $200,000 OTE. An AE’s annual quota is set at a multiple of their OTE, commonly in the 4x to 6x range. For example, an AE with a $150,000 OTE might have a quota around $750,000 in annual contract value (ACV), with quotas ranging from $700,000 to over $1 million depending on company stage and average deal size. On average, about 40-70% of AEs achieve their quota.
Account Manager
An Account Manager focuses on managing and growing existing customer accounts after the initial sale. While AEs hunt for new business, Account Managers act as farmers who cultivate and nurture existing client relationships to drive retention and expansion revenue. Maintaining relationships with existing customers and managing client accounts is crucial for ensuring customer satisfaction, fostering loyalty, and encouraging repeat business. Account Managers also act as a buffer between the sales team and the customer, ensuring a smooth onboarding process and supporting a long-term partnership.
What Are the Key Responsibilities of an Account Manager?
The key responsibilities of an Account Manager are client relationship management, which involves building and strengthening client relationships to create long-term partnerships. The Account Manager acts as the primary liaison between the company and the customer, handling inquiries, addressing concerns, and ensuring the client’s voice is heard within the organization.
Retention is the core focus, as retaining existing clients is more cost-effective than acquiring new customers. This is achieved by ensuring clients are satisfied with the products or services purchased and that their business needs are being met. Upselling and cross-selling involve identifying opportunities to generate new business from existing accounts by upgrading services or offering new products, which requires a deep understanding of the client’s goals and the company’s product offerings.
What Skills Does an Account Manager Need?
An Account Manager needs strong communication, relationship-building, problem-solving, strategic planning, and negotiation skills. They must be able to listen to client needs and clearly convey information to both clients and internal teams. In-depth knowledge of the client’s goals and the company’s products is essential for identifying upselling and cross-selling opportunities, as it enables Account Managers to spot new business possibilities that align with client objectives. The core difference between an Account Manager and an Account Executive is their place in the sales cycle: the AE focuses on hunting for new business, while the AM is a gardener who cultivates existing client relationships post-sale.
What Is the Average Account Manager Salary and OTE in 2025?
The average Account Manager salary and OTE in 2025 is a $100,000 base with an On-Target Earnings (OTE) of $180,000 as of early December 2025. The national average base pay for Account Managers serves as a useful benchmark, helping to compare compensation levels across the United States. Other sources report an average base salary of $84,037 with an average total compensation of $123,215, though there is significant variance in reported salaries with some sources providing a much lower average salary range of $55,000 to $65,000.
What Are Senior and Management Sales Titles?
Senior and management sales titles represent the next level of career progression in sales. These roles involve either managing larger, more complex accounts as an individual contributor or leading and coaching teams of sales professionals. Success at this level requires both deep sales expertise and strong leadership capabilities. Building a strong sales team is essential for driving business growth and succeeding in the competitive nature of the sales industry.
Senior Account Executive
A Senior Account Executive handles larger and more complex sales opportunities. Senior AEs typically focus on mid-market accounts, managing longer sales cycles with multiple stakeholders and higher-value contracts than standard AEs.
What Are the Key Responsibilities of a Senior Account Executive?
The key responsibilities of a Senior Account Executive are managing complex sales cycles. Senior AEs navigate the entire sales process for larger organizations, which involves multiple stakeholders, lengthy negotiations, and higher stakes. They are responsible for identifying high-value prospects, understanding their complex business needs, and proposing tailored solutions.
Achieving high quotas defines the role, as it focuses on closing larger deals to meet significant sales targets. This includes developing strategic territory and account plans, building a strong sales pipeline, and accurately forecasting revenue. Building relationships with senior decision-makers is a critical part of the role, requiring strong business acumen and the ability to articulate a clear value proposition to key stakeholders at the VP level.
What Skills Does a Senior Account Executive Need?
A Senior Account Executive needs advanced sales experience, excellent communication and negotiation skills, strategic planning, and financial acumen (including building ROI models). The ability to manage complex projects is critical. Experience with CRM software like Salesforce is standard.
Enterprise Account Executive
An Enterprise Account Executive handles the largest and most complex sales opportunities. Enterprise AEs focus on organizations with over $5 billion in revenue, managing long sales cycles with multiple stakeholders and high-value contracts.
What Are the Key Responsibilities of an Enterprise Account Executive?
The key responsibilities of an Enterprise Account Executive are managing highly complex sales cycles. Enterprise AEs navigate the entire sales process for the largest organizations, which involves numerous stakeholders across departments, lengthy negotiations spanning months or years, and the highest stakes. They are responsible for identifying enterprise-level prospects, understanding their complex business needs, and proposing comprehensive tailored solutions.
Achieving the highest quotas defines the role, as it focuses on closing the largest deals to meet substantial sales targets. This includes developing strategic territory and account plans, building a strong sales pipeline of major opportunities, and accurately forecasting significant revenue. C-suite relationship building is essential, requiring exceptional business acumen and the ability to articulate a clear value proposition to key decision-makers at the C-suite level.
What Skills Does an Enterprise Account Executive Need?
An Enterprise Account Executive needs extensive enterprise sales experience, exceptional communication and negotiation skills, advanced strategic planning, and sophisticated financial acumen (including building complex ROI models). The ability to manage highly complex, multi-year projects is critical. Deep experience with CRM software like Salesforce is essential. The title Enterprise Account Executive is considered more senior than Senior Account Executive as it implies a focus on the largest and most valuable clients.
What Is the Average Enterprise Account Executive Salary and OTE in 2025?
The average Enterprise Account Executive salary and OTE in 2025 is a $135,000 base with an On-Target Earnings (OTE) of $265,000 as of early December 2025. The national average base pay for Enterprise Account Executives serves as a useful benchmark, helping to compare compensation levels across different regions and companies. Other sources report a wide range, with total compensation potentially reaching $400,000 or more, with one source indicating an average total compensation of $264,000 with a range up to $413,000. There is a clear compensation difference, with Enterprise AEs earning significantly more than Senior AEs.
Sales Manager
A Sales Manager is responsible for leading, coaching, and managing a team of sales representatives to achieve sales targets. This is the first level of sales leadership where success is measured not just by individual performance but by the collective success of the team.
What Are the Key Responsibilities of a Sales Manager?
The key responsibilities of a Sales Manager are developing and implementing strategic sales plans to achieve company goals and expand the customer base. They lead, motivate, coach, and mentor a sales team to maximize performance, including recruiting, setting objectives, training, and monitoring performance.
Analyzing sales metrics, market trends, and competitor activity helps identify areas for improvement and new business opportunities. Managing sales forecasts, budgets, and reporting tracks progress against goals. Building and maintaining strong, long-lasting relationships with key customers and stakeholders is essential. Overseeing the entire sales process, including month-end and year-end close processes, and collaborating with marketing and product teams to align on strategies and promotional campaigns are also key duties.
What Skills Does a Sales Manager Need?
A Sales Manager needs leadership and team management, which involves the ability to hire, train, coach, and motivate a high-performing sales team. Strategic planning requires experience in developing business plans that cover sales, revenue, and expense controls. Analytical skills include proficiency in analyzing sales data, forecasting, and identifying trends to make informed decisions.
Communication and interpersonal skills mean excellent written and verbal communication for leading a team and building client relationships. Customer Relationship Management (CRM) involves experience with CRM software to track sales activities and manage customer interactions. Sales and industry expertise require deep knowledge of sales processes, the company’s products and services, and industry trends. Emotional intelligence is the ability to understand and manage one’s own emotions and those of the team to guide them effectively.
What Is the Average Sales Manager Salary and OTE in 2025?
The average Sales Manager salary and OTE in 2025 ranges between $73,485 and $126,387 for base salary according to various sources. The national average base pay for Sales Managers serves as a useful benchmark, helping to compare compensation levels across different regions and industries. According to the U.S. Bureau of Labor Statistics, the median annual wage for sales managers was $138,060 in May 2024, with employment projected to grow 5 percent from 2024 to 2034.
On-target earnings (OTE), including base salary, bonuses, and commission, range from $100,000 to $180,000. One source reports an average total compensation of $167,347 (average base of $105,241 plus $62,106 additional cash compensation). High-revenue industries like Technology (SaaS), Financial Services, and Healthcare can offer OTEs from $180,000 to $250,000.
Regional Sales Manager
A Regional Sales Manager oversees sales operations and performance within a specific geographic region or territory. Field sales reps, such as Regional Sales Managers and Territory Managers, interact with clients through face-to-face meetings and often travel within their assigned regions to build relationships and drive sales. This role acts as the bridge between national sales strategy and local sales execution, managing multiple sales teams or district managers within the assigned area.
What Are the Key Responsibilities of a Regional Sales Manager?
The key responsibilities of a Regional Sales Manager are overseeing sales operations and performance within a specific geographic region or territory. They develop and implement regional sales strategies, plans, and quotas to align with national objectives and achieve revenue targets. Recruiting, training, coaching, and managing a team of sales representatives or district sales managers within the assigned region is a core duty.
Analyzing regional market trends, competitor activities, and sales data helps identify opportunities for growth and initiate corrective actions. Building and maintaining strong relationships with key customers and partners within the territory is essential. Managing the regional sales budget, forecasting requirements, and reporting on performance and variances are key responsibilities. Acting as the bridge between the national sales strategy and the local sales force ensures company goals are implemented at a regional level.
What Skills Does a Regional Sales Manager Need?
A Regional Sales Manager needs territory management expertise in managing sales activities, resources, and strategies across a specific geographic area. Leadership and team management involve proven ability to lead, motivate, and develop a team of sales professionals to meet regional targets. Strategic planning is the ability to create and execute a regional sales plan that supports national objectives.
Market analysis involves strong analytical skills to assess local market conditions, identify trends, and track competitors. Communication skills include excellent communication and interpersonal skills for managing a team and building rapport with key regional customers. Forecasting and budgeting require proficiency in forecasting regional sales, preparing budgets, and analyzing financial performance.
What Is the Average Regional Sales Manager Salary and OTE in 2025?
The average Regional Sales Manager salary and OTE in 2025 varies significantly, with some sources reporting an average of $95,325, others stating $101,370, and another indicating an average of $126,390, while one source provides a lower average of $91,719. For context, the national average base pay for Regional Sales Managers in the United States is often used as a benchmark to compare these figures and can help highlight how actual salaries may differ by position and location. Total compensation includes the base salary plus commission and bonuses, with ranges from $64,000 to $154,000, which includes a base of $59,000 to $134,000, bonuses up to $39,000, and commissions from $5,000 to $49,000. OTE will vary significantly based on industry, company, and success in meeting regional targets.
What Are Executive-Level Sales Titles?
Executive-level sales titles represent the highest tier of sales leadership within an organization. These professionals set the strategic direction for the entire sales organization, manage large teams of managers, and are directly accountable for company-wide revenue performance. In addition, these leadership positions focus on strategies and opportunities that directly impact business growth and revenue. Success at this level requires a combination of deep sales expertise, strategic vision, and executive leadership skills.
Director of Sales
A Director of Sales, also known as a sales director, is a key leadership role responsible for overseeing sales teams and setting strategic direction. This position oversees multiple sales managers or teams and is responsible for setting regional or divisional sales strategy. This role acts as a key bridge between front-line sales management and executive leadership.
What Are the Key Responsibilities of a Director of Sales?
The key responsibilities of a Director of Sales are designing and implementing strategic sales plans to achieve company objectives and sales targets. They manage, motivate, and lead sales teams and sales managers to improve performance. Developing and promoting weekly, monthly, and quarterly sales objectives is a core duty, along with overseeing day-to-day sales operations within a specific region or for a particular product line.
Recruiting, hiring, and training sales staff falls under their responsibility. Drafting detailed and accurate sales reports and forecasting future sales is essential. Cultivating lasting relationships with key customers to grow loyalty is important. Assessing costs, competition, and market trends to identify selling prices and opportunities is a key function. Working with customers to understand their business needs and goals is also part of the role.
What Skills Does a Director of Sales Need?
A Director of Sales needs leadership and team management, which involves the ability to motivate, mentor, and manage sales teams to foster a culture of high performance and accountability. Strategic thinking and planning include developing long-term sales strategies, analyzing market trends, and setting realistic goals. Communication and interpersonal skills mean excellent written and verbal communication for articulating vision, providing feedback, and building relationships.
Data analysis and reporting require proficiency in using CRM data and analytics to inform strategy, forecast sales, and report on performance. Sales process knowledge involves in-depth understanding of the entire sales cycle, from lead generation to closing. Negotiation skills include the capacity to manage complex negotiations with clients and partners. Tech savviness means familiarity with CRM software like Salesforce, sales automation tools, and data analytics platforms.
What Is the Average Director of Sales Salary and OTE in 2025?
The average Director of Sales salary and OTE in 2025 shows a significant range in reported salaries, with some sources reporting an average base salary of $154,000, others estimating it at $162,219, and another providing a similar average of $158,773, while one source gives a lower average of $103,985. For context, the national average base pay for Directors of Sales serves as a useful benchmark to compare these figures and understand how compensation may vary by region and company size.
Total compensation (OTE – On-Target Earnings) includes base salary plus additional cash compensation like bonuses and commissions, with one source reporting an average total compensation of $264,504, with the additional cash portion averaging $110,504. Experience significantly impacts salary, with a senior-level director (8+ years) earning an average of $207,771, while an entry-level director (1-3 years) earns around $88,125.
Vice President (VP) of Sales
A Vice President of Sales manages the entire sales department and sets company-wide sales strategy. This executive role is responsible for overall revenue performance and typically reports directly to the CEO or Chief Revenue Officer.
What Are the Key Responsibilities of a VP of Sales?
The key responsibilities of a VP of Sales are developing and executing the company’s overall, high-level sales strategy to align with business objectives and drive revenue growth. They set the vision and long-term goals for the entire sales organization. Leading, mentoring, and scaling the entire sales department, including Sales Directors and managers, is a core responsibility.
Collaborating with other C-level executives (CEO, CMO, CFO) ensures cross-functional alignment on go-to-market strategy. Establishing and overseeing high-level sales targets, forecasts, and budgets for the entire department is essential. Analyzing market trends, competitive landscapes, and data to identify new opportunities for market expansion and growth is a key function.
Optimizing sales processes, methodologies, and implementing sales technologies (CRM) on a large scale is important. Representing the company in major client negotiations and building relationships with key strategic partners is part of the role. Reporting on overall sales performance, pipeline health, and revenue forecasts to the CEO and board is a critical duty.
What Skills Does a VP of Sales Need?
A VP of Sales needs executive leadership, which involves the ability to set a vision, inspire a large organization, and influence company-wide strategy. Strategic planning requires expertise in developing long-term, high-level sales and go-to-market strategies. Financial acumen means strong understanding of budgeting, revenue forecasting, and managing a profit and loss statement.
Cross-functional collaboration is the skill in working with other executive leaders in marketing, product, and finance to align goals. Data-driven decision making involves the ability to analyze complex sales data and market trends to make strategic decisions. Team scaling and development require experience in recruiting, building, and mentoring a multi-layered sales organization, including managing other leaders. Market analysis involves deep knowledge of market dynamics, competitive analysis, and identifying opportunities for expansion.
What Is the Average VP of Sales Salary and OTE in 2025?
The average VP of Sales salary and OTE in 2025 shows variation, with some sources reporting an average base of $165,921, others providing a similar figure of $169,384, one source showing an average lower at $158,060, while on the higher end, another reports an average of $207,284, and one cites $225,041. The national average base pay for VPs of Sales serves as a useful benchmark for comparing these figures across different regions and companies.
The VP of Sales role includes significant variable compensation, with one source reporting an average total compensation (OTE) of $350,198, with an average additional cash component of $142,914. The role requires 10+ years of senior sales experience.
Chief Revenue Officer (CRO)
A Chief Revenue Officer is the highest-level executive overseeing all revenue-generating departments. A CRO has a broad mandate that includes sales, marketing, and customer success, managing the entire customer lifecycle to maximize revenue growth.
What Are the Key Responsibilities of a CRO?
The key responsibilities of a CRO are strategic leadership, which involves developing and executing comprehensive revenue growth strategies and aligning sales, marketing, and customer success departments. Departmental oversight means directly managing and unifying all go-to-market functions, including sales, marketing, customer success, and revenue operations (RevOps) to create a seamless customer journey.
Financial management includes owning the company’s revenue-generating performance, focusing on key metrics like Net Revenue Retention (NRR), Customer Lifetime Value (CLV), and Customer Acquisition Cost (CAC). Team leadership involves building and leading high-performance teams across all revenue functions, fostering a culture of accountability and continuous improvement. Data analysis and forecasting require utilizing data analytics to forecast revenue, identify market trends, and make informed decisions to optimize strategies.
What Skills Does a CRO Need?
A CRO needs strategic planning and business acumen, financial proficiency (profit and loss management, pricing strategies), leadership and cross-functional team management, data analysis and technological expertise (CRM, analytics tools), and strong communication and relationship building. The CRO role is a modern, holistic position, emerging from the need in subscription-based (SaaS) businesses to manage the entire customer lifecycle, focusing on retention and expansion, not just the initial sale. The primary metric for a CRO is often Net Revenue Retention (NRR).
What Is the Average CRO Salary and OTE in 2025?
The average CRO salary and OTE in 2025 shows significant variation based on source, experience, and location. As a benchmark, the national average base pay for CROs provides a useful reference point for comparing compensation levels across the United States. One source reports an average base salary of $239,055 and an average total compensation (OTE) of $415,719 for 2025. Data from December 2025 suggests an average base salary of $336,460, with top earners reaching $407,643. Another source offers a slightly lower average of $242,148 for 2025, while one estimates an average base salary of $183,000 for 2025, with a total pay range of $125,000 to $319,000. The significant difference in reported salaries highlights the high variability of the role’s compensation, which is heavily influenced by bonuses, commissions, and company performance.
Chief Sales Officer (CSO)
A Chief Sales Officer is the highest-level executive overseeing the sales function. While a CRO has a broader mandate across all revenue departments, a CSO focuses primarily on sales execution and strategy.
What Are the Key Responsibilities of a CSO?
The key responsibilities of a CSO are strategic leadership focused on sales, which involves developing and executing comprehensive sales strategies to drive revenue growth. Sales department oversight means directly managing and leading the entire sales organization to achieve targets.
Financial management includes owning the company’s sales performance, focusing on key metrics like sales bookings, quota attainment, and pipeline health. Team leadership involves building and leading high-performance sales teams, fostering a culture of accountability and continuous improvement. Data analysis and forecasting require utilizing data analytics to forecast sales, identify market trends, and make informed decisions to optimize sales strategies.
What Skills Does a CSO Need?
A CSO needs strategic planning and business acumen focused on sales, financial proficiency (profit and loss management, pricing strategies), leadership and sales team management, data analysis and technological expertise (CRM, analytics tools), and strong communication and relationship building. Unlike a CRO who covers the entire customer lifecycle, the CSO focuses primarily on sales execution. The primary metric for a CSO is sales bookings.
What Are Specialized Sales Roles?
Specialized sales roles are positions that support and enhance the direct selling process without carrying individual sales quotas. These roles have become increasingly important in modern sales organizations, particularly in B2B and SaaS companies, where technical complexity and operational efficiency are critical to success. Some companies also provide professional services as part of their sales offerings, delivering specialized consulting or expert support to clients.
The effective use of sales tools is essential in supporting specialized sales roles, as these tools help improve team productivity, streamline processes, and enable sales personnel to focus on high-value activities.
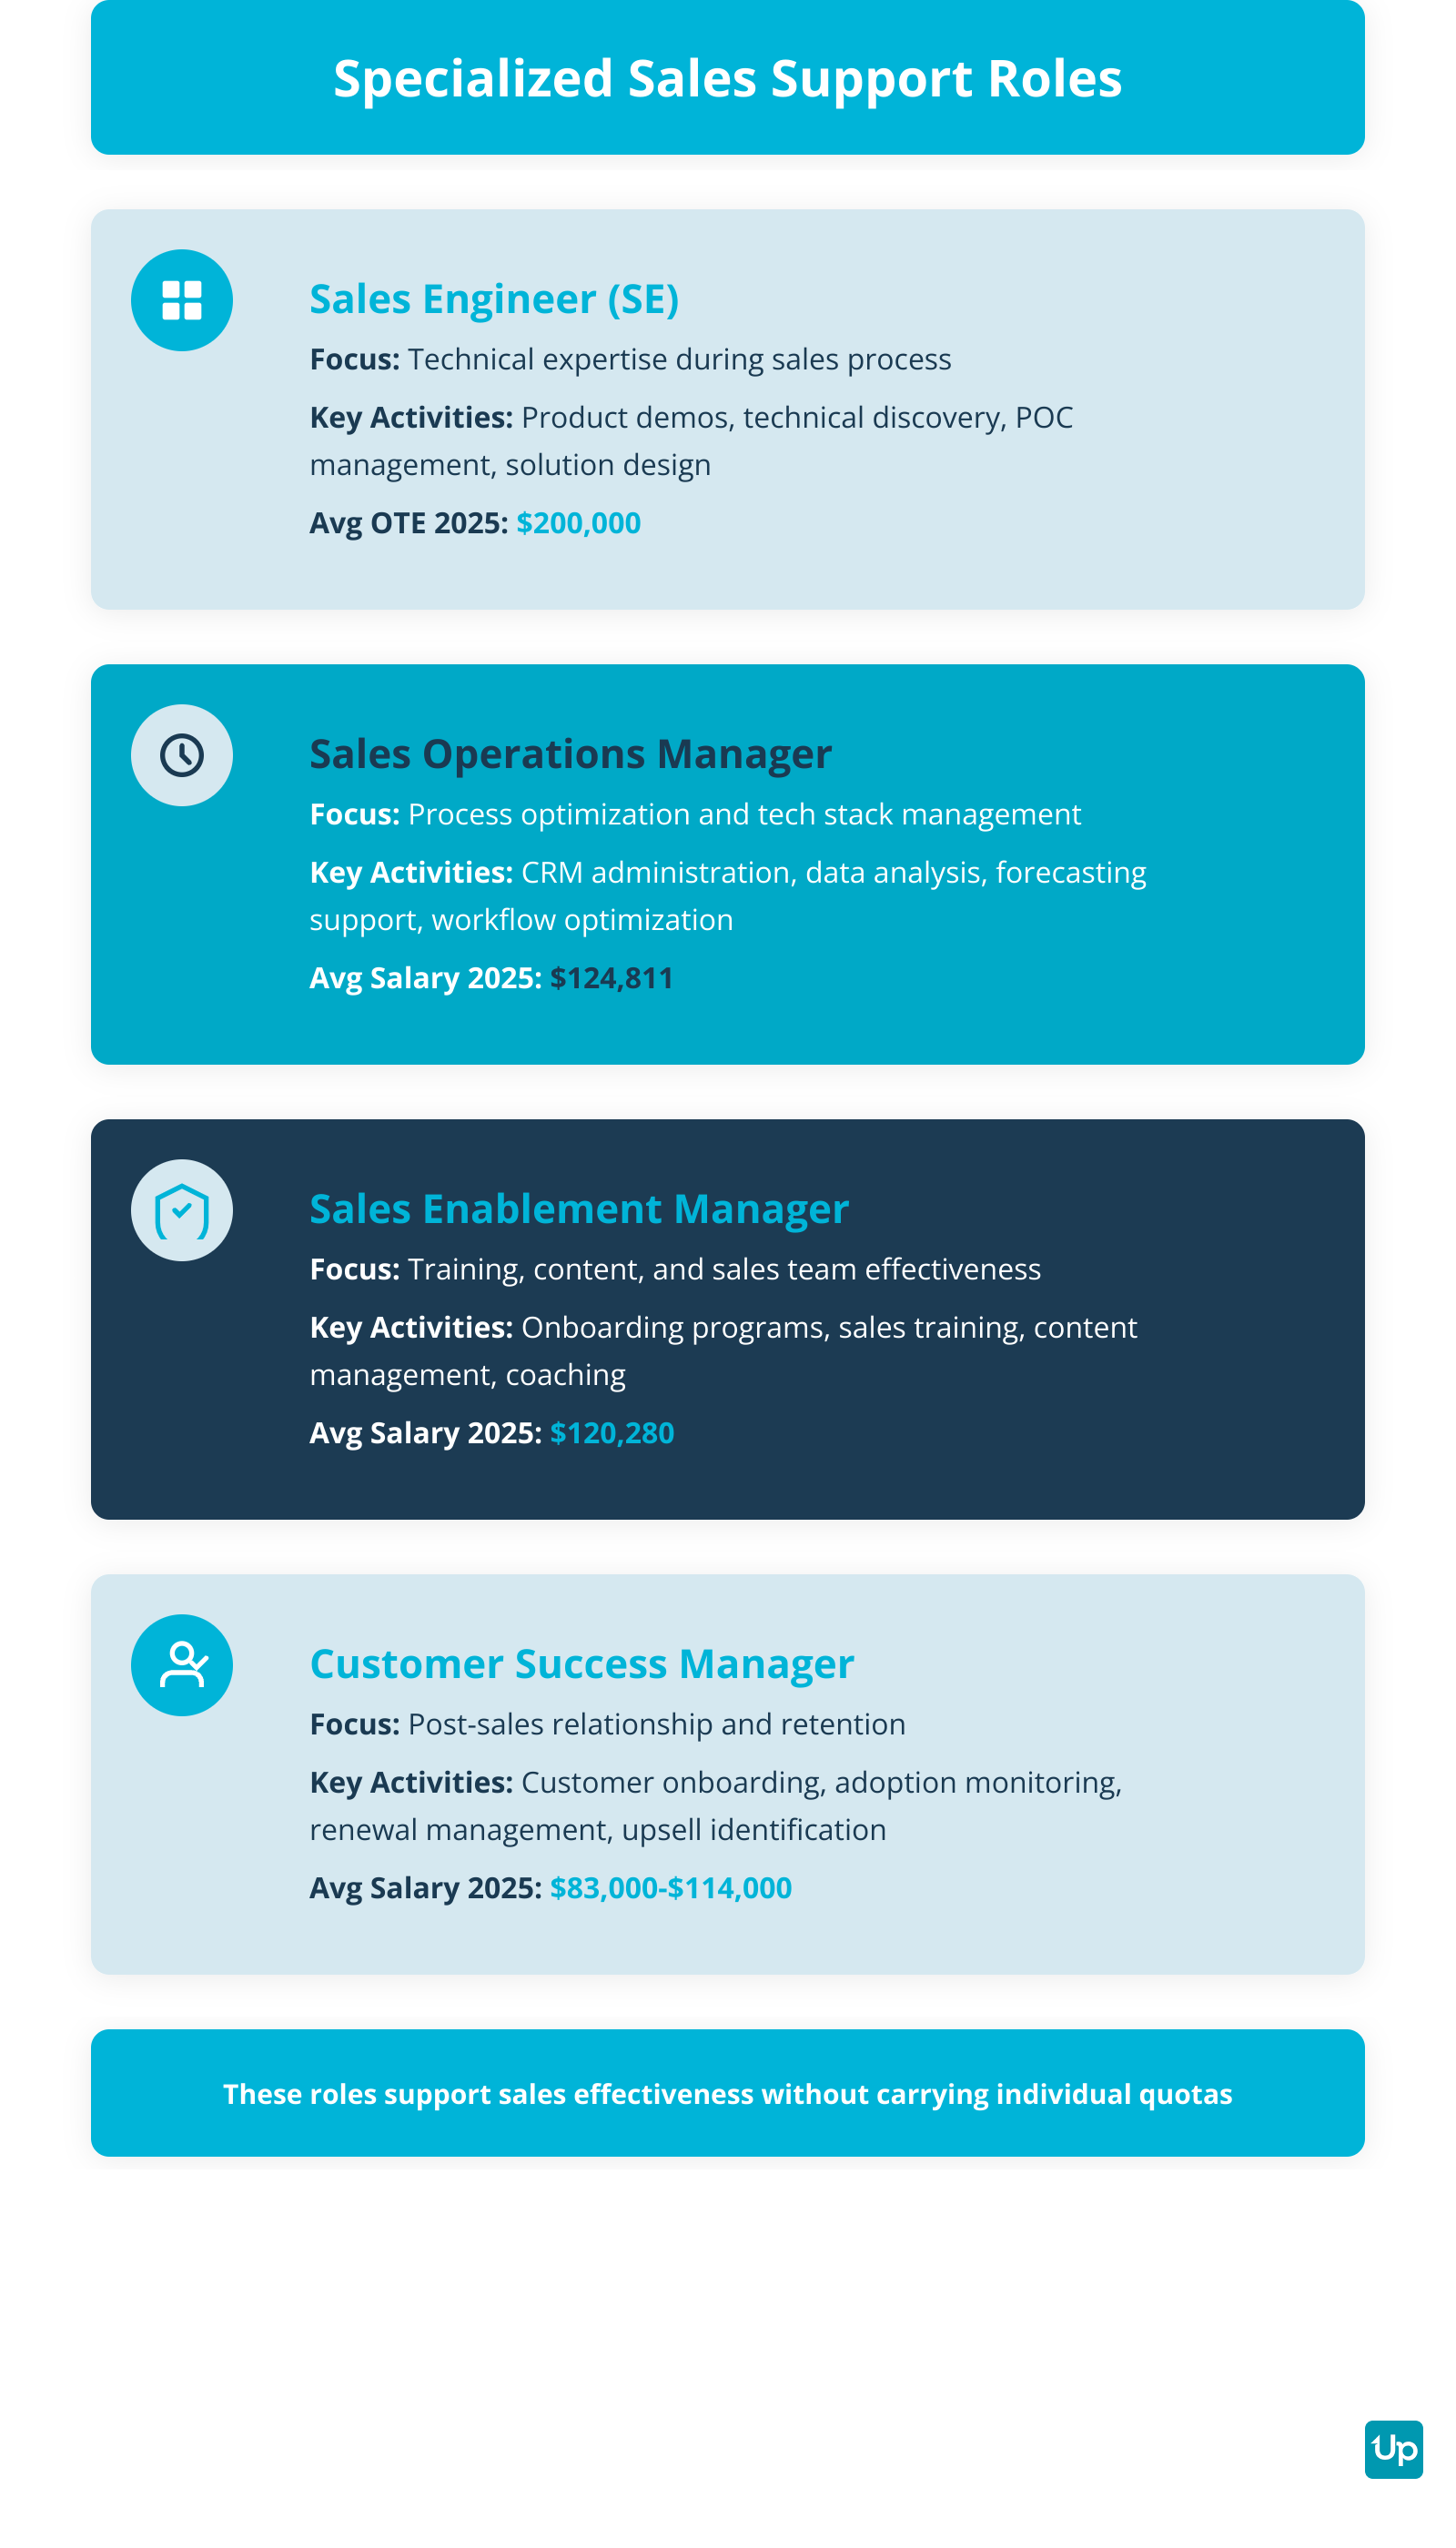
Specialized Sales Roles and Responsibilities
Sales Engineer (SE) and Solutions Consultant
A Sales Engineer acts as the technical expert and trusted advisor during the sales process, bridging the gap between sales teams and technical product capabilities. This role is crucial in B2B sales of complex scientific and technological products.
What Are the Key Responsibilities of a Sales Engineer?
The key responsibilities of a Sales Engineer are technical discovery and consultation, which involves engaging with prospective customers to understand business needs, pain points, and technical requirements. Product demonstrations include delivering customized and compelling product demos showcasing value aligned with the client’s specific use cases.
Solution design and proposals mean architecting tailored solutions to meet customer needs and assisting in crafting technical sections of proposals and RFP/RFI responses. Proof of concept management involves leading or supporting POCs to prove the solution’s value and feasibility in the customer’s environment. Cross-functional collaboration includes acting as the voice of the customer to internal product and engineering teams and collaborating with sales to strategize on deals.
What Skills Does a Sales Engineer Need?
A Sales Engineer needs technical expertise, which requires deep knowledge of the product, underlying technologies, and competitive landscape. Communication and presentation involve the ability to explain complex technical concepts in simple, easy-to-understand manner for both technical and non-technical audiences. Problem-solving includes strong analytical skills to understand customer challenges and devise effective solutions.
Business acumen means understanding of sales processes and ability to connect technical features to business value and ROI. Interpersonal skills involve building rapport and trust with customers.
What Is the Average Sales Engineer Salary and OTE in 2025?
The average Sales Engineer salary and OTE in 2025 is $200,000 for median On-Target Earnings as of December 2025, including a median base salary of $145,000, with 55.1% of Sales Engineers achieving their quota. For comparison, the national average base pay for Sales Engineers provides a useful benchmark to evaluate how these figures align with compensation trends across the United States.
Sales Operations Manager
A Sales Operations Manager is responsible for increasing sales team efficiency and effectiveness by optimizing processes, managing technology, and analyzing data. This is a non-quota-carrying role focused on making the sales team more productive.
What Are the Key Responsibilities of a Sales Operations Manager?
The key responsibilities of a Sales Operations Manager are process optimization, which involves analyzing, defining, and improving sales processes, workflows, and policies to reduce friction and boost productivity. Data analysis and reporting include creating and maintaining reports and dashboards to track KPIs like win rates, pipeline health, and quota attainment, providing actionable insights to leadership.
CRM and tech stack management mean administering the CRM system like Salesforce to ensure data integrity and managing the broader sales technology stack. Sales forecasting and planning involve supporting or leading sales forecasting, territory planning, and quota setting processes. Cross-functional collaboration includes partnering with Sales, Marketing, and Finance to ensure strategic alignment and smooth operations.
What Skills Does a Sales Operations Manager Need?
A Sales Operations Manager needs analytical skills, which include strong ability to work with large datasets to identify trends and insights. Systems proficiency requires advanced skills in CRM software like Salesforce or HubSpot and data tools like Excel, with familiarity with BI platforms like Tableau or Looker being a plus.
Problem-solving involves a proactive attitude toward identifying and solving process bottlenecks. Communication means the ability to clearly present data-driven recommendations to stakeholders. Project management includes strong organizational skills to manage multiple initiatives.
What Is the Average Sales Operations Manager Salary in 2025?
The average Sales Operations Manager salary in 2025 is approximately $124,811 for total compensation, including $108,283 base salary. The national average base pay for Sales Operations Managers serves as a useful benchmark, helping to compare compensation levels across different regions and companies.
Sales Operations Analyst
A Sales Operations Analyst supports sales team efficiency by analyzing data, building reports, and maintaining systems. This role is more hands-on with data analysis, report building, and CRM maintenance compared to the more strategic Sales Operations Manager role.
What Are the Key Responsibilities of a Sales Operations Analyst?
The key responsibilities of a Sales Operations Analyst are data analysis and reporting, which includes building and maintaining reports and dashboards to track KPIs like win rates, pipeline health, and quota attainment. CRM maintenance means ensuring data integrity in the CRM system like Salesforce and supporting the sales team with system issues.
Process support involves assisting in analyzing and improving sales processes and workflows. Sales forecasting support includes helping with sales forecasting, territory planning, and quota setting processes. Cross-functional support includes working with Sales, Marketing, and Finance to provide data and insights.
What Skills Does a Sales Operations Analyst Need?
A Sales Operations Analyst needs analytical skills, which include strong ability to work with large datasets to identify trends and insights. Systems proficiency requires advanced skills in CRM software like Salesforce or HubSpot and data tools like Excel, with familiarity with BI platforms like Tableau or Looker being a plus.
Problem-solving involves a proactive attitude toward identifying and solving process bottlenecks. Communication means the ability to clearly present data-driven recommendations to stakeholders. Attention to detail ensures accuracy in data analysis and reporting.
What Is the Average Sales Operations Analyst Salary in 2025?
The average Sales Operations Analyst salary in 2025 is around $80,473 for total compensation, including $71,043 base salary. The national average base pay for Sales Operations Analysts serves as a useful benchmark, helping to compare compensation levels across different regions and companies.
Sales Enablement Manager
A Sales Enablement Manager is responsible for equipping sales teams with the necessary training, content, processes, and tools to improve sales productivity and drive revenue. This strategic role focuses on the human side of sales effectiveness, complementing the technical focus of Sales Operations.
What Are the Key Responsibilities of a Sales Enablement Manager?
The key responsibilities of a Sales Enablement Manager are onboarding and training, which involves designing and implementing comprehensive onboarding for new hires and continuous training programs for the existing sales team, covering product knowledge, sales methodologies like SPIN or Challenger, and process updates.
Content creation and management include collaborating with marketing to create, organize, and manage sales collateral including case studies, presentations, datasheets, and proposal templates, ensuring they are accessible and effective. Technology and tools management involve managing and optimizing the sales tech stack including CRM software and other sales enablement platforms, and training the team on effective tool usage.
Strategy and process optimization mean analyzing sales data and performance metrics to identify process bottlenecks and areas for improvement, developing and refining sales processes to increase efficiency and effectiveness. Cross-functional alignment involves acting as a liaison between sales, marketing, and product teams to ensure consistent messaging and smooth feedback loops.
What Skills Does a Sales Enablement Manager Need?
A Sales Enablement Manager needs hard skills including CRM expertise, data analysis, project management, and content management. Soft skills include strong communication, leadership, coaching, problem-solving, and adaptability.
What Is the Average Sales Enablement Manager Salary in 2025?
The average Sales Enablement Manager salary in 2025 is approximately $120,280 per year for base salary, with the range falling between $111,403 (25th percentile) and $130,190 (75th percentile), with top earners reaching over $139,000, and senior roles averaging $161,249 annually. For comparison, the national average base pay for Sales Enablement Managers across the United States is a useful benchmark to evaluate how these figures align with broader compensation trends.
Customer Success Manager (CSM)
A Customer Success Manager is a post-sales role focused on building long-term customer relationships, ensuring clients achieve their desired outcomes, and maximizing retention and loyalty. Customer Success Managers focus specifically on customer onboarding, value delivery, and managing renewals to ensure client loyalty. Maintaining relationships with existing customers is crucial for customer satisfaction and loyalty, as ongoing communication, gratitude, and engagement help foster loyalty, encourage referrals, and ensure repeat business. This role is distinct from customer support, which is reactive, whereas customer success is proactive and strategic.
What Are the Key Responsibilities of a Customer Success Manager?
The key responsibilities of a Customer Success Manager are customer onboarding and training, which involves guiding new customers through the initial setup and training process to ensure they can effectively use the product. Proactive relationship management includes building strong relationships through regular check-ins, proactively addressing potential issues, and aligning the product’s value with the customer’s goals.
Driving adoption and value means monitoring customer health and usage metrics to encourage deep product adoption and ensure customers are realizing the product’s value. Retention and churn reduction involve owning customer retention by fostering loyalty, managing renewals, and implementing strategies to mitigate churn risks.
Identifying expansion revenue includes uncovering opportunities for upselling and cross-selling by understanding customer needs and demonstrating how additional features or products can provide more value. Customer advocacy means acting as the voice of the customer internally, providing feedback to product, sales, and marketing teams to improve the overall customer experience.
What Skills Does a Customer Success Manager Need?
A Customer Success Manager needs empathy and relationship building, strategic and proactive problem-solving, strong communication and presentation skills, data analysis to monitor customer health, project management and time management, and in-depth product knowledge.
What Is the Average Customer Success Manager Salary in 2025?
The average Customer Success Manager salary in 2025 varies by source, with one source stating an average annual salary of $83,064 as of December 2025, with a majority range between $59,500 and $99,000. The national average base pay for Customer Success Managers serves as a useful benchmark for comparing these figures across the United States. Another report indicates a median salary of $88,500 for 2025 in the US. One source reports a higher average of $91,915, with a total compensation average of $111,134 including additional cash compensation. Another provides the highest average at $114,040 as of December 2025, while one reports a lower average of $78,135 for 2025. This variation suggests that experience, location, and company size significantly impact compensation.
How Do Creative Sales Titles Compare to Traditional Titles?
Creative sales titles compare to traditional titles by offering attention-grabbing alternatives that can communicate company culture but often create confusion and practical challenges. Companies often create different sales job titles to align with their company values and culture, ensuring that the roles reflect both organizational principles and the evolving nature of sales strategies. Understanding when and why to use creative titles versus traditional ones is an important strategic consideration that reflects your company culture and recruiting approach.
Creative titles like Sales Rockstar, Revenue Ninja, or Director of First Impressions can attract attention and communicate a fun, modern work environment. They can boost employee morale by making team members feel valued and special. Unique titles also generate conversation and can increase social sharing of job postings.
However, creative titles come with significant drawbacks. They cause recruiting and SEO confusion because recruiters and job seekers search for standard titles like Account Executive. A creative title may be missed by search engine algorithms and human scanners, reducing the visibility of your job posting. They create external and internal ambiguity, as customers and colleagues may be confused about the person’s role and seniority.
Creative titles can become a resume liability, as quirky titles may not translate well and can be a disadvantage when the employee seeks their next job. They hinder career progression clarity because traditional title hierarchies provide a clear path for advancement, while creative titles can obscure this path and create issues with internal equity and pay scales. Using creative titles to cover the real purpose of a sales role can also create mistrust, as most B2B buyers know that titles like Relationship Manager translate to Salesperson.
The best practice is to use standard titles for external recruiting and job postings to ensure you appear in relevant searches. You can use creative internal titles for team morale if your company culture supports it, but always maintain a standard title equivalent for external use. Remember that your audience and industry matter more than anyone else when deciding on sales job titles.
How Is AI Changing Sales Roles in 2025?
AI is changing sales roles in 2025 by automating repetitive tasks and providing data-driven insights, transforming salespeople into more strategic, efficient, and data-driven professionals rather than replacing them. According to a 2023 study from OpenAI and the University of Pennsylvania, around 80% of the U.S. workforce could have at least 10% of their tasks affected by Large Language Models.
The primary impact is automation of repetitive, low-value tasks, freeing up significant time for sellers to focus on high-value human activities that AI cannot replicate. Studies show sellers spend only about 25-35% of their time actively selling, with the rest going to non-selling activities. AI automates data entry and CRM hygiene by logging call summaries, updating contact records, and maintaining pipeline data. It handles lead management through AI-powered systems that score and prioritize leads based on historical data and engagement signals. Scheduling and follow-ups are automated, including meeting scheduling and routine follow-up emails. The effective use of sales tools further boosts efficiency and productivity, enabling sales professionals to close more deals by streamlining processes and supporting the sales team.
AI acts as a co-pilot, providing data-driven insights that enhance strategic capabilities. Predictive analytics analyze data to improve sales forecasting accuracy, predict deal closure likelihood, and identify at-risk accounts. Hyper-personalization at scale allows generative AI to draft personalized outreach emails tailored to a prospect’s industry, role, and pain points. Conversation intelligence analyzes sales calls to identify winning patterns, common objections, and key customer moments.
This shift elevates the importance of strategic and relational skills over repetitive ones. Roles focused heavily on manual prospecting and data entry are most vulnerable to transformation, while strategic sellers who build trust, navigate complex negotiations, and provide consultative guidance become more valuable. Importantly, 82% of consumers report wanting more human interaction as technology like AI becomes more common, underscoring the enduring value of the human touch in sales.
How Much Do Sales Professionals Earn? (2025 Salary Guide)
Sales professionals earn compensation that combines a base salary with variable compensation (commission or bonus), creating On-Target Earnings (OTE). Understanding sales compensation is critical for both career planning and team budgeting. The national average base pay serves as a useful benchmark for comparing salaries across different sales roles, helping professionals and employers understand how actual pay varies by position and location. Here is a comprehensive salary guide for key sales roles in 2025 based on recent US market data.
For entry-level roles, Sales Development Representatives earn a median base salary of $55,000-$60,000 with median OTE of $85,000 in a 65-70% base and 30-35% variable structure. Business Development Representatives earn an average base of approximately $59,000 with average OTE around $91,805. Sales Associates in retail or direct sales earn an average base of $45,046, with a range of $37,000-$50,000.
Mid-level roles show significant increases. Account Executives in SMB or Mid-Market segments earn a median base of $70,000-$85,000 with median OTE of $130,000-$165,000. Enterprise Account Executives earn a median base of $130,000 with median OTE of $260,000. Account Managers earn a median base of $100,000 with median OTE of $180,000.
Management and senior roles command higher compensation. Sales Managers earn a median base of $120,000-$130,000 with median total compensation of $160,000-$180,000, with bonuses ranging from 30-50% of base salary. Regional Sales Managers earn an average base around $95,000-$126,000 with total compensation including bonuses and commissions.
Executive-level positions offer the highest earnings. Directors of Sales earn a base salary range of $154,000-$162,000 with total compensation ranging from $264,000 to over $400,000 for senior-level directors. Vice Presidents of Sales earn an average base of $165,000-$225,000 with average total compensation of $350,198. Chief Revenue Officers earn an average base of $239,000-$336,000 with average total compensation of $415,719, though top earners can exceed $400,000.
Specialized roles also offer competitive pay. Sales Engineers earn a median OTE of $200,000 with a base of $145,000. Sales Operations Managers earn average total compensation of $124,811. Sales Enablement Managers earn an average base of $120,280. Customer Success Managers earn an average of $83,000-$114,000 depending on experience and company.
These figures vary significantly based on industry, company size, location, and individual performance. High-revenue industries like Technology (SaaS), Financial Services, and Healthcare offer compensation at the higher end of these ranges.
Frequently Asked Questions
What Is the Most Common Sales Title?
The most common sales title is Sales Representative or Account Executive based on data from job boards and industry analysis. Sales Representative is a classic, broadly understood title for a front-line salesperson focused on selling products or services and managing customer relationships. Account Executive is also extremely common, often referring to a role focused on closing deals and managing a portfolio of accounts. Other very frequent titles include Sales Development Representative (SDR) and Business Development Representative (BDR) for lead generation, and Account Manager for managing existing client relationships.
What Is the Typical Career Path in Sales?
The typical career path in sales follows a structured progression from entry-level to executive leadership, generally taking 5-6 years to reach a Vice President level for high performers. Entry-level (0-18 months) starts with Sales Development Representative (SDR) or Business Development Representative (BDR), where professionals learn the fundamentals including prospecting, researching leads, cold outreach, and qualifying leads.
Mid-level (2-5 years) progresses to Account Executive (AE), the most common promotion for successful SDRs, responsible for the full sales cycle including conducting product demos, managing objections, negotiating terms, and closing deals. The management track (3-5+ years) leads to Sales Manager for high-performing AEs with leadership skills, responsible for recruiting, training, and coaching a team of reps.
Senior leadership includes Director of Sales and Vice President of Sales, culminating in a Chief Revenue Officer (CRO) or Chief Sales Officer (CSO) role. An alternative path for individual contributors progresses from AE to Senior AE to Enterprise AE, focusing on increasingly complex and valuable accounts.
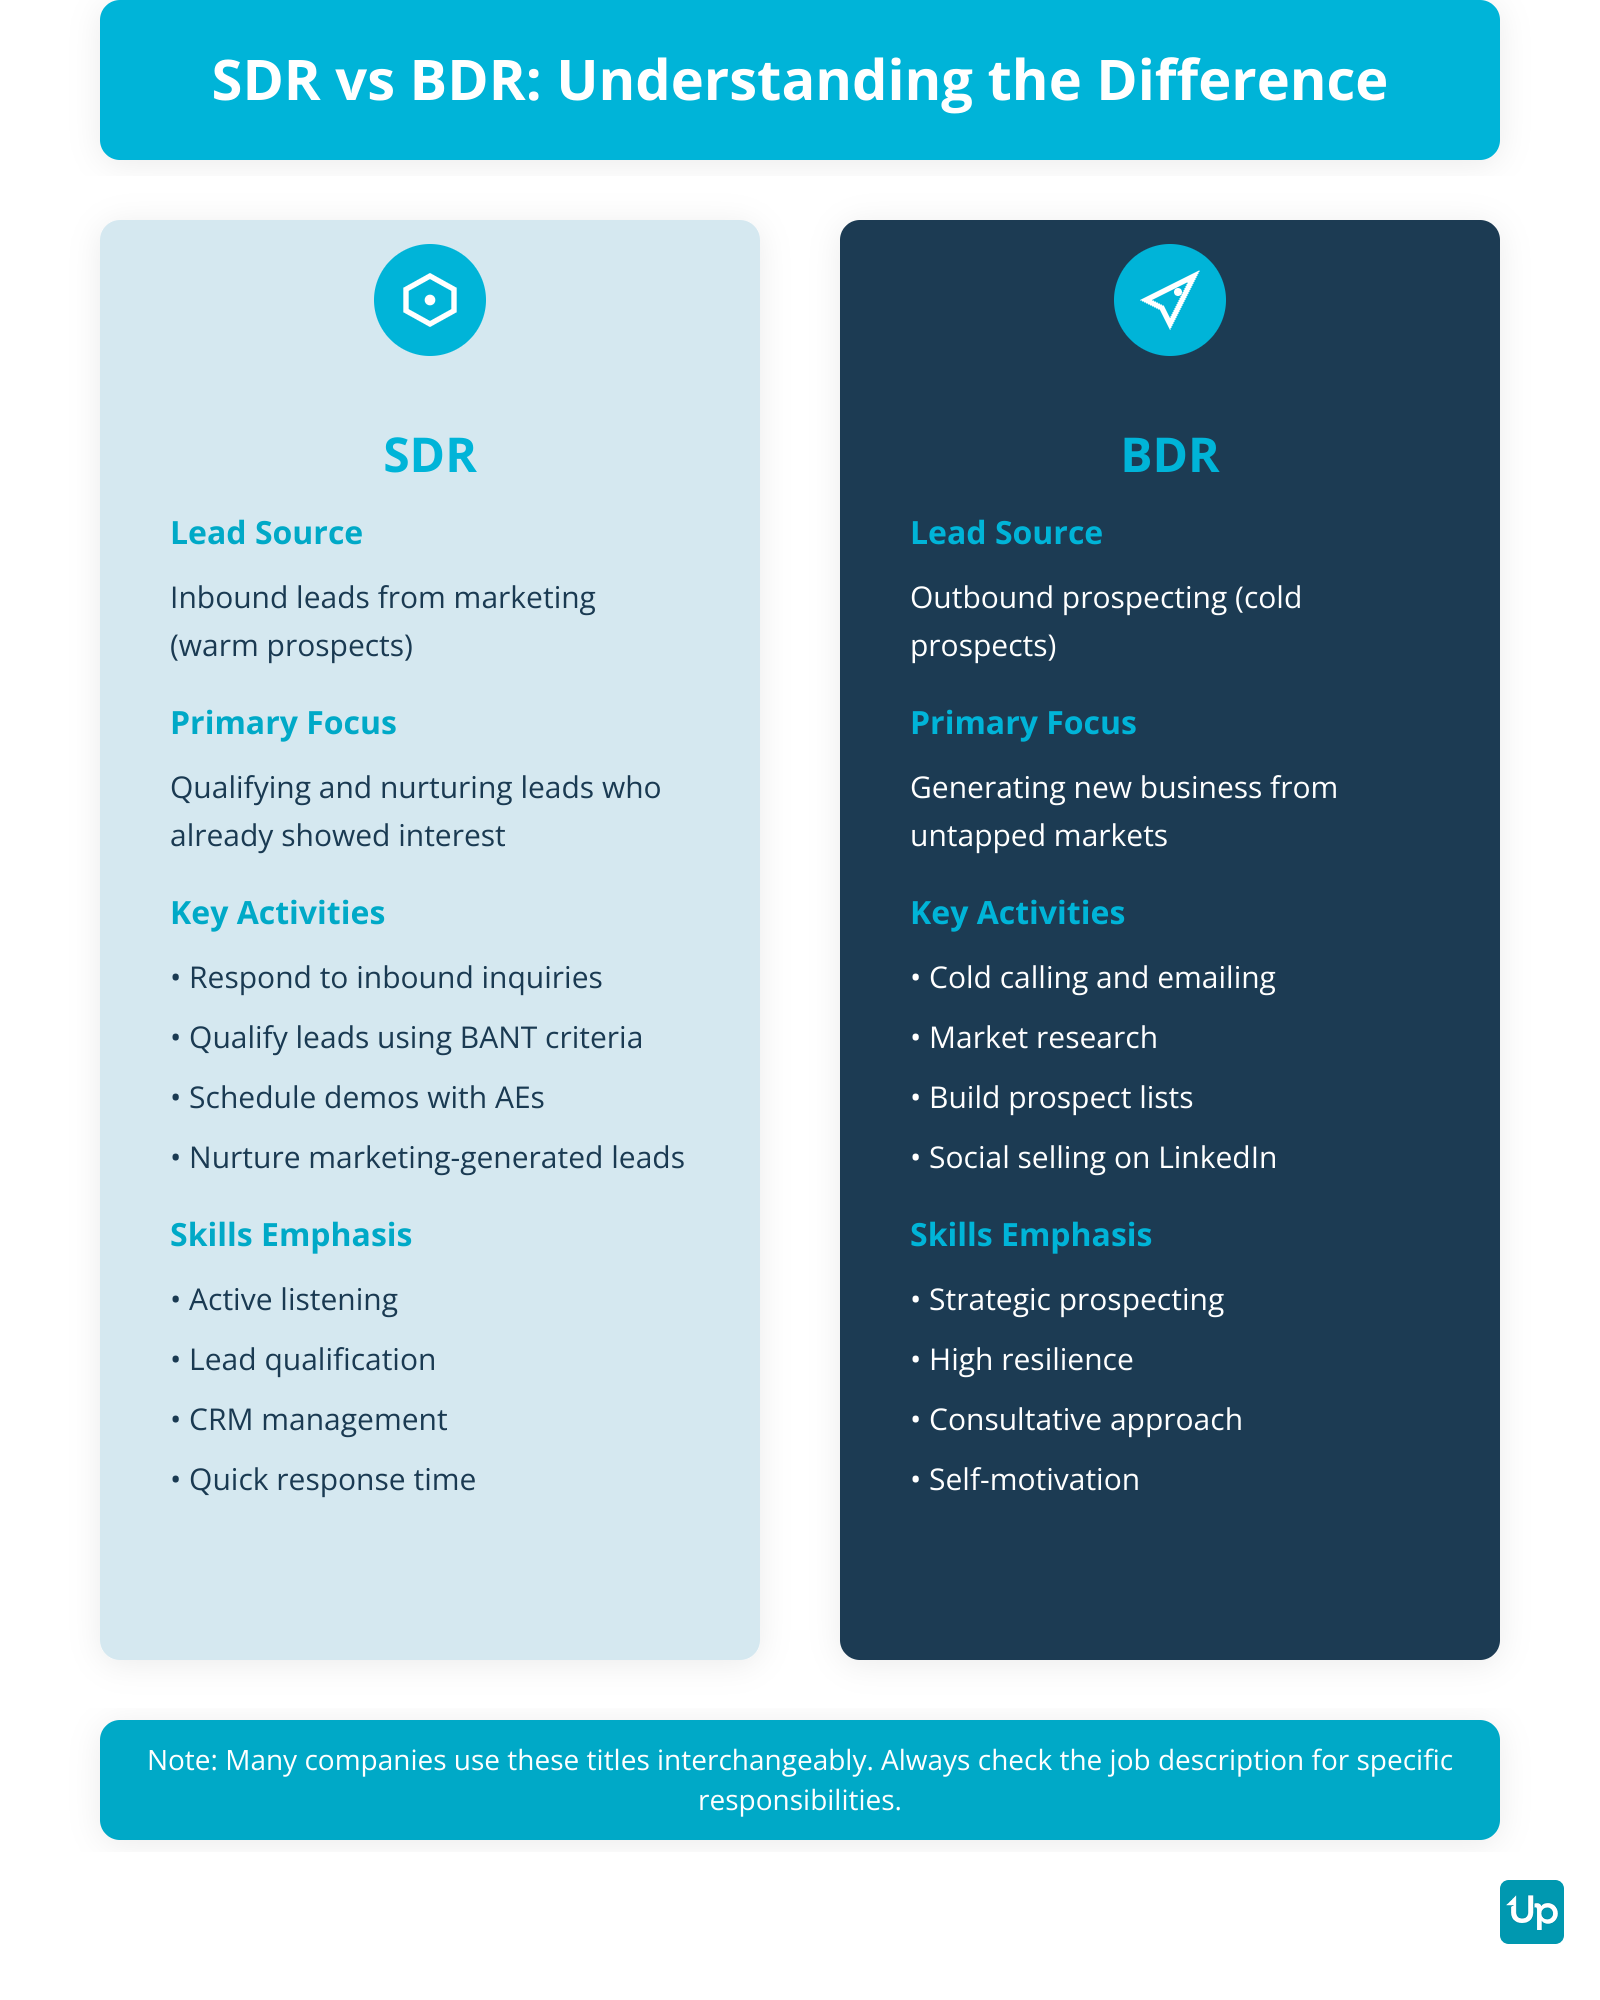
What Is the Difference Between an SDR and a BDR?
The difference between an SDR and a BDR is that SDRs typically focus on qualifying inbound leads, while BDRs focus on generating new business through outbound prospecting. An SDR is primarily responsible for managing and qualifying inbound leads, which are potential customers who have already shown interest in the company by taking an action such as downloading a whitepaper or requesting a demo. A BDR focuses on outbound prospecting, often called hunting, proactively seeking out new business opportunities in untapped markets through strategic research, cold calling, cold emailing, and social selling. Despite this distinction, the terms SDR and BDR are often used interchangeably, and the specific responsibilities can vary significantly from one company to another.
What Is the Highest-Paying Sales Job?
The highest-paying sales job is typically Chief Revenue Officer (CRO) with average total compensation around $403,000, followed by Vice President of Sales and Enterprise Account Executive roles. Key high-paying roles include Chief Revenue Officer (CRO) with average total compensation around $403,000, Vice President of Sales with total pay ranging from $98,000 to over $268,000, Enterprise Software Sales or Enterprise Account Executive with OTE frequently ranging from $225,000 to $400,000 or more, Medical Device Sales Representative with average total compensation around $178,277, and Sales Engineer with median pay of $121,520 according to the U.S. Bureau of Labor Statistics.
Compensation in top sales roles is heavily influenced by On-Target Earnings (OTE), which is a combination of base salary and variable commission or bonuses, with top performers who significantly exceed their sales quotas earning far more than the average OTE.
Looking for sales leaders to reach out to? Try UpLead and get verified emails and mobile direct dials of Sales VPs, SDR managers, Account Executives, and more. First 5 leads are free.